Here’s something to get you started:
#import "@preview/cetz:0.3.2": canvas, draw
#import "@preview/cetz-plot:0.1.1": plot
// Load CSV and separate first row from others
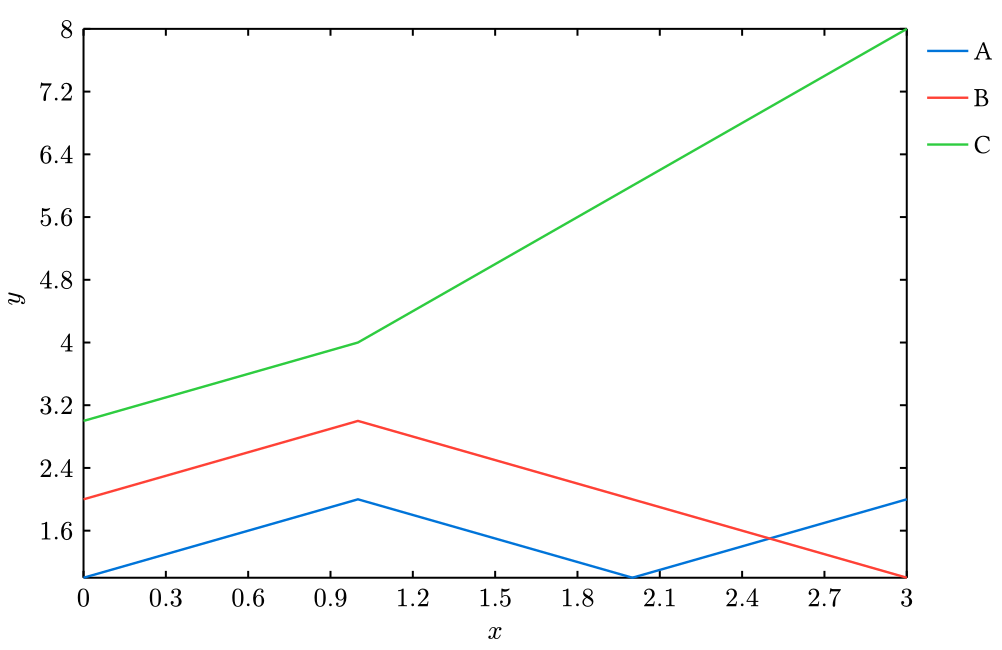
#let (names, ..data) = csv.decode(```
Date,A,B,C
2023-01-01,1,2,3
2023-01-02,2,3,4
2023-01-03,1,2,6
2023-01-04,2,1,8
```.text)
// Hack: use TOML parser to parse date strings
#let dates = data.map(x => toml.decode("date = " + x.first()).date)
// Each x value is the number of days since the first row date
#let xs = dates.map(x => (x - dates.first()).days())
// Make an array of (x, y) coordinates for the given column index
#let series(j) = range(data.len()).map(i => (xs.at(i), float(data.at(i).at(j))))
#canvas({
import draw: *
// Set-up a thin axis style
set-style(
axes: (stroke: .5pt, tick: (stroke: .5pt)),
legend: (stroke: none, orientation: ttb, item: (spacing: .3), scale: 80%),
)
plot.plot(size: (12, 8), {
for j in range(1, names.len()) {
plot.add(series(j), label: names.at(j))
}
})
})
To load CSV data from a file, use #let (names, ..data) = csv("file.csv") instead.