You’re absolutely right, CeTZ is essentially the ‘TikZ’ of Typst. It’s incredibly powerful and gives you pixel-perfect control, but the learning curve is definitely steeper because you often have to build things from the ground up.
Lilaq is usually the ‘sweet spot’ for most users because it automates the tedious parts (like axes and ticks) while still being very customizable.
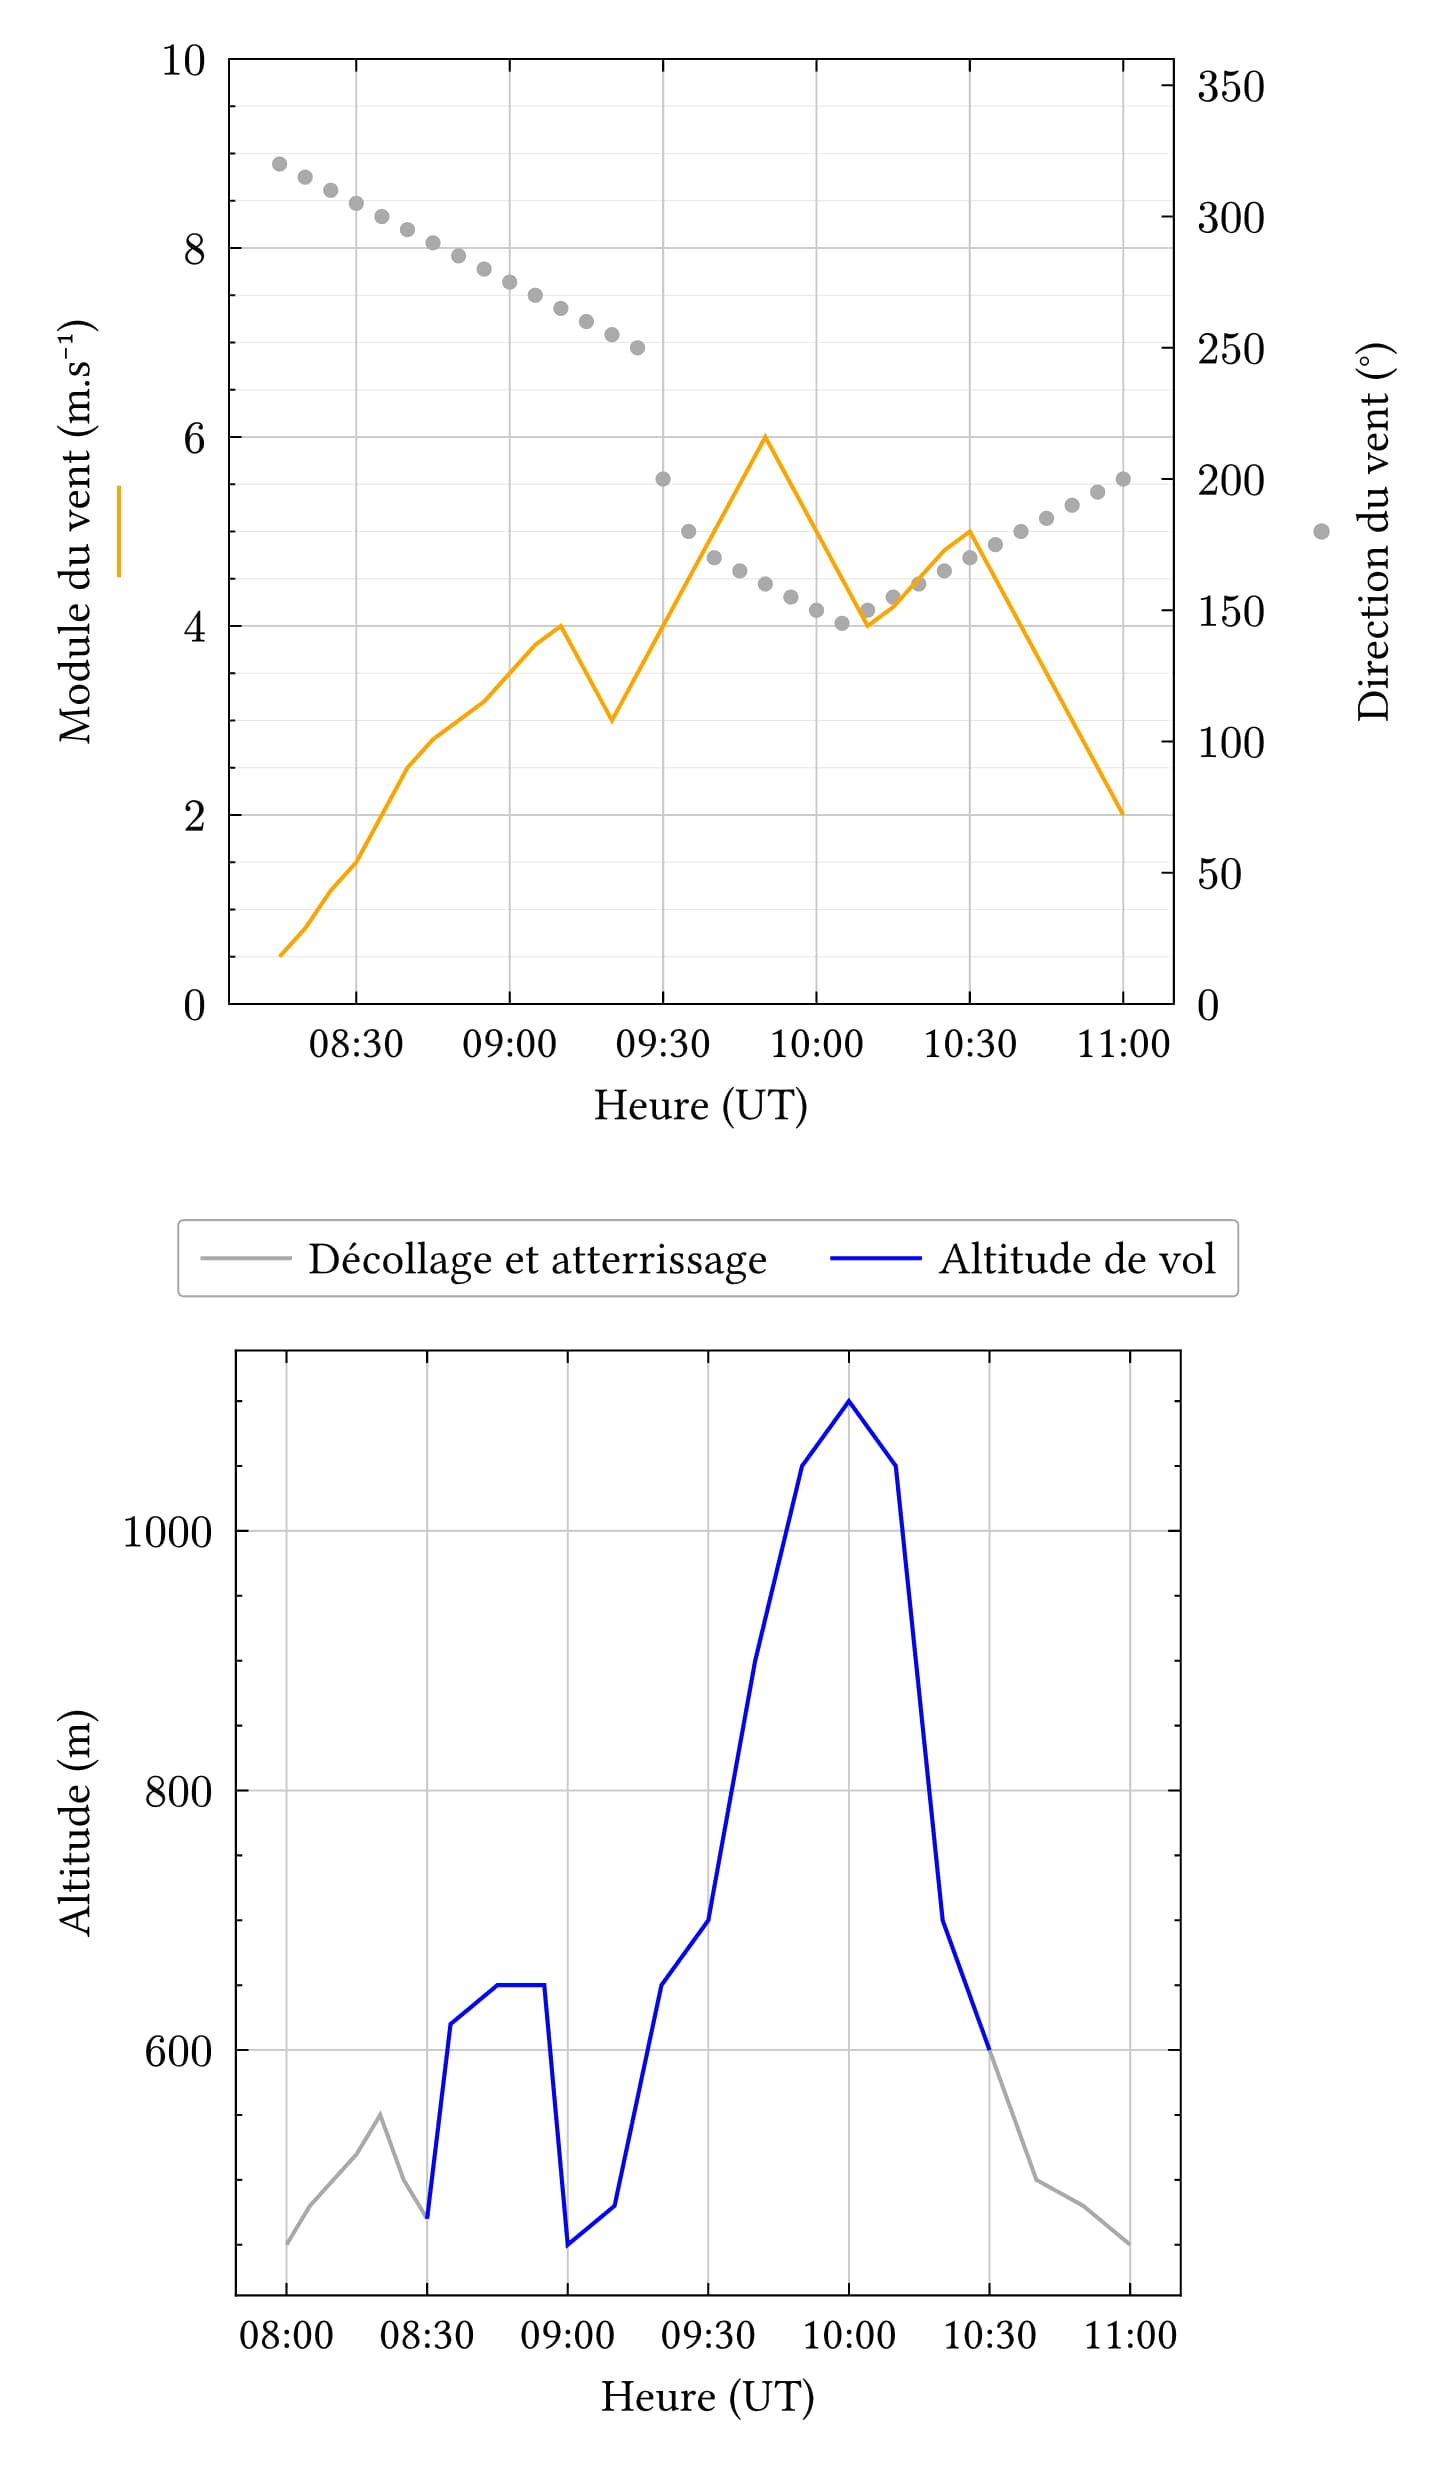
To show you how close you can get to your Matplotlib layout, I actually took the liberty of recreating your plots in Lilaq:
https://typst.app/project/R8WMgiMZltMLiFsgQRFQVJ
The big advantage here is that in the code, you can define the exact width and height of the plotting area itself. Even if one graph has labels on both sides and the other doesn’t, the ‘boxes’ containing the data will remain exactly the same size and perfectly aligned.
Maybe this template helps you decide if switching is worth it. Once the layout is set up once, you just have to swap the data!