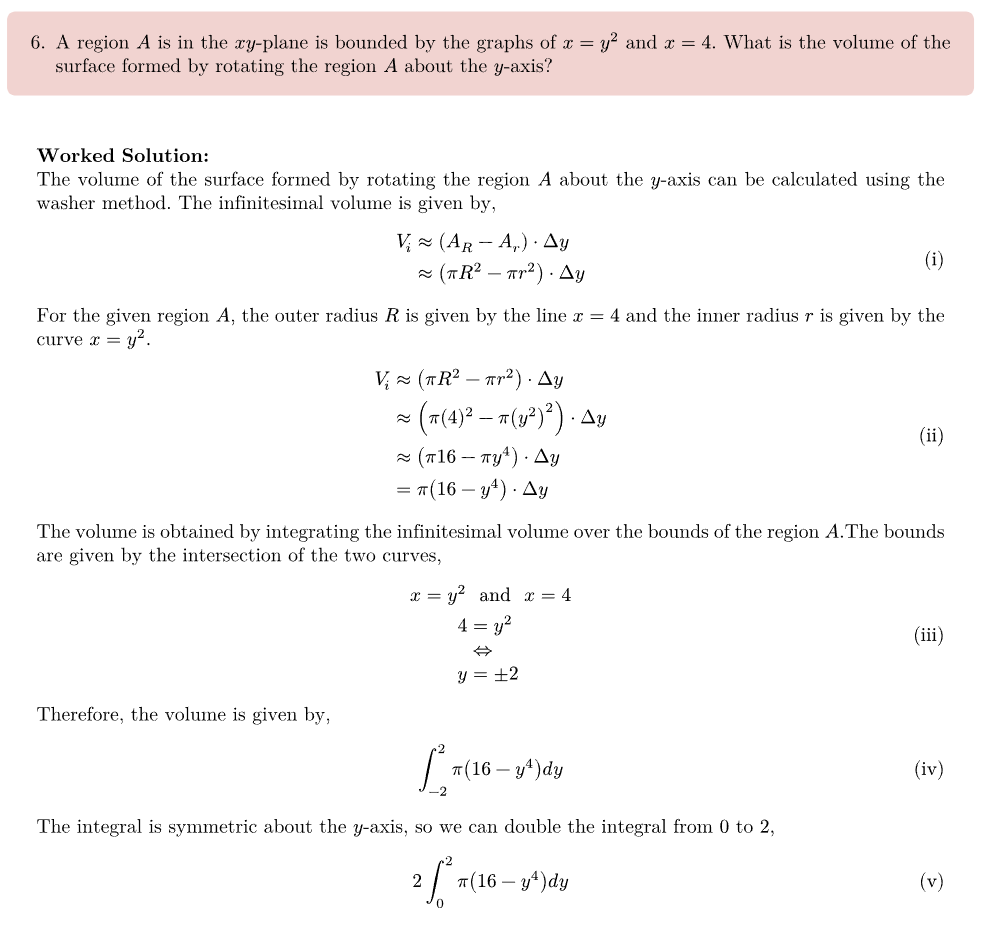
I’m trying to create an illustration to accompany a math problem. The problem asks to rotate a region bounded by two curves about the y-axis (see image below).
I’m fairly new to using Cetz and Lilaq, and I’m struggling to find a starting point. Would anyone have any suggestions?
Goals:
- plot the 2 curves
- plot the surfaces they create/rotated volume
- plot the infinitesimal volume cut out depicting large R and small r
- add accompanying content/text
From what I’ve found, I would need to know how to plot the surface or its parametrization, and I’m wondering if there is an easier way.