Hello!
I have the following code:
Code
#import "@preview/cetz:0.3.1"
#import "@preview/cetz-plot:0.1.0": *

  #cetz.canvas({
    import cetz.draw: *

    let style = (stroke: black, fill: rgb(0, 0, 200, 75))

    let f1(x) = calc.sin(x)
    let nonum(eq) = math.equation(block: true, numbering: none, eq)
    let fn = (
      (black, nonum($ "Wendland Quintic" $), q => float(q >= 0) * float(q <= 2) * ((1-q/2)*(1-q/2)*(1-q/2)*(1-q/2)*(2*q + 1)) + float(-q >= 0) * float(-q <= 2) * ((1--q/2)*(1--q/2)*(1--q/2)*(1--q/2)*(2*-q + 1))),
    )
      let fn_der = (
      (black, nonum($ "Wendland Quintic - dWdq" $), q => float(q >= 0) * float(q <= 2) * ((5/8)*q*(q - 2)*(q - 2)*(q - 2)) + float(-q >= 0) * float(-q <= 2) * ((5/8)*(q)*(-q - 2)*(-q - 2)*(-q - 2))),
    )

    set-style(
      mark: (fill: black, scale: .3),
    )

    // Center of Circle
    let (cx,cy) = (0,0); let radius = 3;
    circle((cx,cy), radius: radius, fill: red.transparentize(80%), stroke: (dash: "dashed"))

    line((cx, cy), (cx + 1, cy), mark: (end: "stealth"))
    content((), nonum($ q $), anchor: "west")
    line((cx, cy), (cx    , cy + 1), mark: (end: "stealth"))
    content((), nonum($ W $), anchor: "west")
    circle((cx,cy), radius: .15, fill: green, stroke: (thickness: 0.5pt), name: "green_dot")
    content((), nonum($ i $), anchor: "north")
    circle((cx - 2.25 , cy - 1), radius: .15, fill: yellow, stroke: (thickness: 0.5pt), name: "yellow_dot")
    content((), nonum($ j $), anchor: "north")

    line( (cx - 2.25, cy - 1),(cx, cy), mark: (start: "stealth", end: "stealth"), name: "ij_line")
    content(
      ("ij_line.start", 50%, "ij_line.end"),
      angle: "ij_line.end",
      padding: .1,
      anchor: "north",
      nonum($ norm(bold(x)_i - bold(x)_j) $)
    )

    // Perform plot
    plot.plot(size: (12, 8),
      scale: 0.1,
      x-label: none,
      y-label: none,
      // x-tick-step: 1,
      // x-format: plot.formats.multiple-of,
      // y-tick-step: 0.25, y-min: -1.25, y-max: 1,
      axis-style: none,
      legend: none,
      {
        let domain = (-2, 2)

        for ((paint, title, f)) in fn {
          plot.add(f, style: (stroke: (paint: paint)), domain: domain, label: title)
        }
        for ((paint, title, f)) in fn_der {
          plot.add(f, style: (stroke: (paint: paint, dash: "dashed")), domain: domain, label: title)
        }

      })


  })
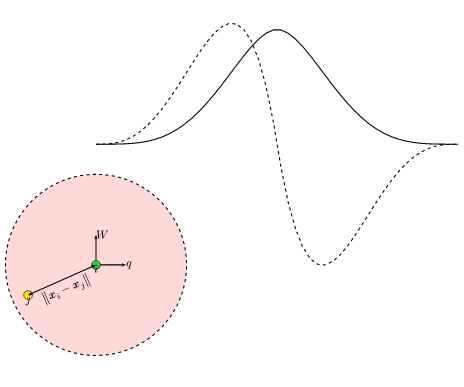
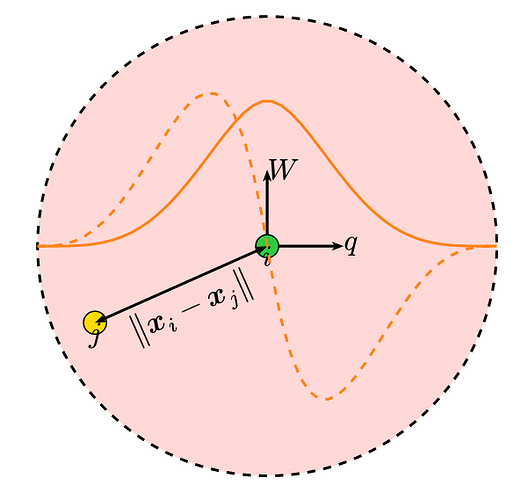
It produces the following image:

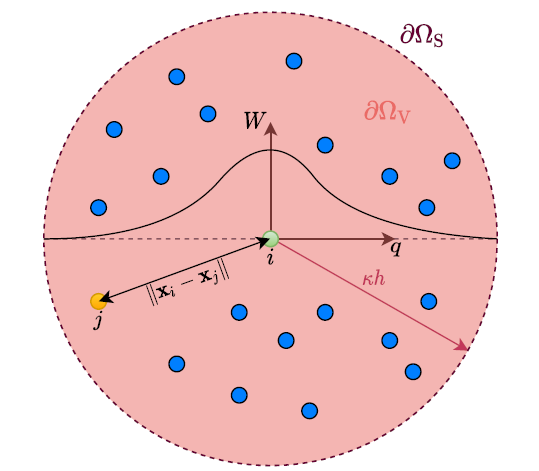
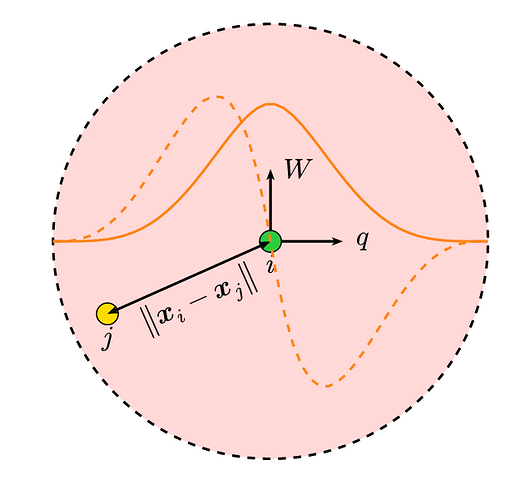
I need it to produce something closer to:

So basically I need to:
- Align the figure in the middle
- Insert the functions in the span of the circle
- Modify text labels, so they are not on top of dots
- Bonus: Add blue dots in a nice manner
Would anyone be able to show me how to reach this kind of graphic?
Kind regards


