Mc-Zen
August 25, 2025, 6:54am
1
Hello everyone!
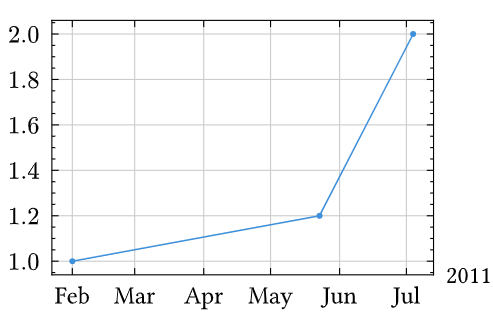
There have been repeated requests for time-series plotting with Lilaq and now I have almost implemented it:
#let xs = (
  datetime(year: 2011, month: 2, day: 1),
  datetime(year: 2011, month: 5, day: 23),
  datetime(year: 2011, month: 7, day: 4)
)

#lq.diagram(
  lq.plot(xs, (1, 1.2, 2))
)
The question is: what is the best default for formatting datetime ticks? I find other plotting tools a bit unsatisfactory in this regard and would like to do it better. Note that Lilaq allows everything to be configured, this question is mostly about the default!
You are welcome to read this post in the pull request that adds the datetime support and share your opinion. Thank you!
Let me comment on the most important problems/questions about datetime tick form… atting. Feel free to share your opinion.
# A word about datetime tick formatting
A good default for automatic formatting gave me such a headache. Dates and times are awful to format _consistent_, _concise_, and _unambigous_ all at the same time!
As far as my research went, no one has ever solved this problem, at least not to my satisfaction. Many plotting library just don't support datetimes and others just have fixed formatters. Matplotlib have gotten pretty far with their `ConciseDateFormatter` but it too has several serious flaws.
## Years
Years are easy. Here we just use a linear locator and formatting is straightforward.
<img width="620" height="222" alt="image" src="https://github.com/user-attachments/assets/9db9d30d-1db0-4ea5-8d92-766377f71e3d" />
## Months
Here is where the problems begin. It would be nice to just show the months and have the redundant year information just once (instead of supplying 2002-Jan, 2002-Feb, 2002-Mar for instance). Often there is not a lot of space for tick labels and vertical tick labels (rotated by 90°) are not always an option and harder to read.
Matplotlib has the [`ConciseDateFormatter`](https://matplotlib.org/stable/gallery/ticks/date_concise_formatter.html) for this. For months, it adds the year at the end of the axis where usually the exponent or offset is shown (see first image in the next panel). In the following I will refer to this as the _offset_.
Also `ConciseDateFormatter` replaces Januaries with the corresponding year. That is not a bad idea but now we may have the year information twice: once in the axis offset and once as a replacement of January. This is not so nice. But the bigger problem _occurs when the year changes mid-axis_. Should the year offset show the first year on the axis? Or the last one because it is shown at the far right of the axis? Matplotlib chooses the latter option but I find it rather confusing. We need something better that is never ambiguous.
I chose to show the year offset at the end of the axis only when the year does not change mid-axis. Also, to cut the redundancy, the offset is not shown, when there is a January replaced by the new year (this "redundancy avoidance" can also be turned off if undesired).
<img width="652" height="472" alt="image" src="https://github.com/user-attachments/assets/aa500b4b-11f8-4a02-bc32-0e0538a5dc76" />
We pay with a slight lack of consistency. Sometimes there is a year offset at the end of the axis and sometimes there isn't. I think it's okay, because this is always configurable, we are just talking about a sensible default. And ambiguity is worse than inconsistency. I would also find it acceptable to never show the offset at all (by default). The price is that the year info might be missing altogether but it's the task of an author to tell the user in the diagram title or figure caption.
## Days
Days work the same as months, just one step down the ladder. Note that the offset may sometimes only show the year, when the month is ambiguous or redundant but the year is not.
<img width="734" height="486" alt="image" src="https://github.com/user-attachments/assets/5fff5dff-fab4-418d-989b-11522280d10d" />
Note that the "smart firsts" (here the first of the month being replaced by the month name) can be turned off. The offset reacts to that.
## Time
Hours, minutes and seconds work very similarly.
<img width="851" height="254" alt="image" src="https://github.com/user-attachments/assets/5b239eb1-0cd9-4496-a262-e7824eb618e1" />
<img width="846" height="260" alt="image" src="https://github.com/user-attachments/assets/1e69f591-eb3a-412d-b315-c0e81c93f70b" />
## Configuration
So this is how the default behaves, how do we configure and tweak it?
First off, there is a `format-ticks` argument for `axis` that can be [changed to a custom formatter just like with the other formatters](https://lilaq.org/docs/tutorials/ticks#custom-tick-formatting). Since this is a rather big step, there are several ways to tweak the default formatter.
1. The default datetime tick formatter is `format-ticks-datetime`. It has two parameters that can be changed:
- `format` can take a function or a [datetime display format string](https://typst.app/docs/reference/foundations/datetime/#format)
- `format-offset` takes a function `(ticks, key: "") => ..` where `ticks` are all ticks in datetime format and `key` is the main component of the date that changes with the ticks, e.g., `"years"` or `"days"`.
```typ
#lq.diagram(
xaxis: (format-ticks: lq.format-ticks-datetime.with(format: "[month]-[day]"))
)
```
2. The default value for `format` is `smart-format` which is an elembic type that allows for configuration of the different cases for the `key`. Here, it is also possible to deactivate `smart-first` which is responsible for replacing Jan->Year, 01->Month, and 00:00->Day.
```typ
#show lq.set-datetime-smart-format(
month: "[month repr:long]", /* can take a format string */
minute: "[hour padding:none]:[minute]",
second: time => str(time.seconds()), /* or a function */
smart-first: false
)
```
3. The behaviour of the "smart first" can be tweaked through the `tick-datetime-smart-first` type in a similar way to `smart-format`.
4. The default value for `format-offset` is `smart-offset` which can be tweaked through the `tick-datetime-smart-offset` type, also in a similar way.
5. The offset at the end of the axis can always be overriden manually:
```typ
#lq.diagram(
xaxis: (offset: [2001])
)
```
## Subticks
I don't think we need subticks for now and in many cases they don't really make sense anyway.
## About the names
The names for these components like `format-ticks-datetime` may still change. Once there are built-in user-defined types, all tick locators and formatters can be scoped to `lq.tick`, e.g., `lq.tick.locate.linear` and `lq.tick.format.datetime`. This makes it easier to find something unknown through IDE suggestions.
---
Otherwise, tt's starting to look really good and will soon be ready for merging!
6 Likes
Hi there! Maybe you should change your category to General? I feel like this is more like a discussion and not a question/problem about Typst itself. Something similar was done by laurmaedje here
3 Likes
Mc-Zen
August 25, 2025, 9:25am
3
Hi @Adrian_Weitkemper , you are right!
I’ve read the post and I think the choices you made to:
Only show the year offset if the year doesn’t change on the time axis, and
Drop the offset if one of the Januaries is replaced with a year
are good defaults. However, there is one case with the second point I don’t understand. What happens if January isn’t part of the set of tick labels, but the year still jumps? For instance, say one starts measurements in October and alternates months, so the time axis is filled with {October, December, February, April}. What happens then? Does the February instead get replaced with the new year?
2 Likes
Mc-Zen
August 25, 2025, 1:02pm
5
Hi @Paul744 ,
The default locator will always place a tick at Januaries. In the case that every second month is displayed, it will always be the odd ones: January, March, May, July, September, November. The same holds for days, hours, and so on.
Mc-Zen
August 25, 2025, 1:37pm
6
If the user deviates too much from the default setting by changing the configuration, there might again be redundancies or missing information. But once a user starts to tweak, they also get more aware to filling in the missing information.
It’s very complex and impossible to do it right for everyone but I had two main desiderata:
It should be configurable such that everything is possible to achieve.
The default should never be ambiguous or redundant.
The second point is especially important in the light of the fact that the defaults are often left as-is and not thought about much by many users. Bad defaults then put the burden on the readers.
3 Likes