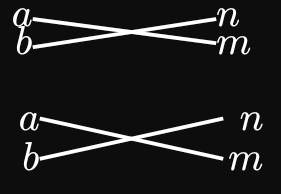
You can do
#figure({
  grid(
    columns: (auto, 50pt, auto),
    align: (right, center, left),
    stack(dir: ttb, $a$, $b$),
    grid(
      line(start: (0%, 0.5em), end: (100%, 1.1em)),
      line(start: (0%, 0.1em), end: (100%, -0.6em)),
    ),
    stack(dir: ttb, $n$, $m$),
  )
})

#figure({
  grid(
    columns: (1em, 50pt, 1em),
    // row-gutter: 1em,
    rows: 1em,
    align: (right, center, right),
    $a$,
    grid.cell(rowspan: 2, grid(
      line(start: (0%, 20%), end: (100%, 70%)),
      line(end: (100%, -50%)),
    )),
    $n$,
    $b$,
    $m$,
  )
})
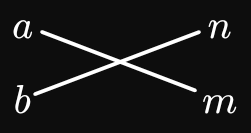
But this is highly restrictive. It’s better to opt into a drawing package.
#import "@preview/fletcher:0.5.8": *

#figure(diagram(spacing: (4em, 1em), node-inset: 1pt, edge-stroke: 1pt, {
  node((0, 0))[$a$]
  edge()
  node((1, 1))[$m$]
  node((0, 1))[$b$]
  edge()
  node((1, 0))[$n$]
}))