CeTZ: How to render plot axes labels in math font and italicized?

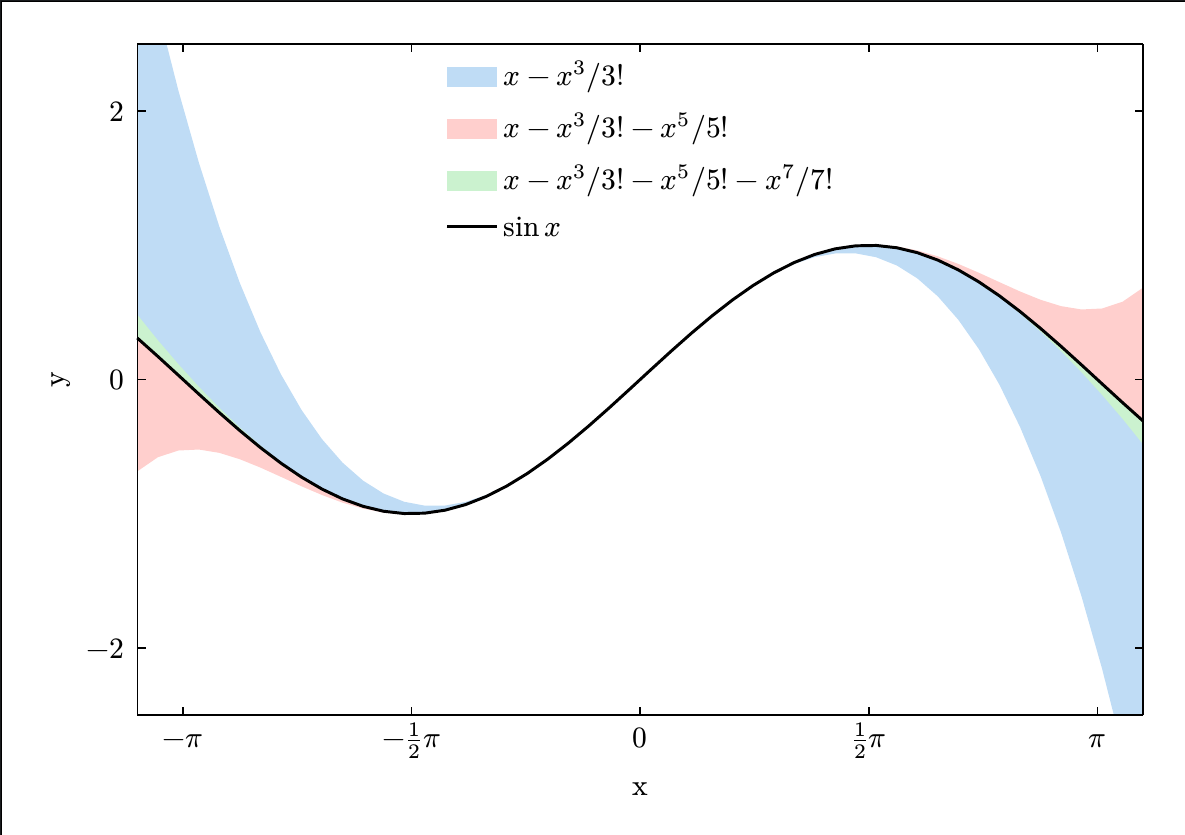
According to this gallery example, the legend is in a math font, but the axes labels, $x$ and $y$ are not. The available CeTZ manual examples show axes labels in math font.

How does one get axes labels in the math font in the recent gallery example?

This is a bug due to Single letter strings get parsed as italicized in math mode · Issue #274 · typst/typst · GitHub.

As a workaround, you can pass the axis labels via:

plot.plot(
  ..., 
  x-label: $x$,
  y-label: $y$,
  ...)
1 Like