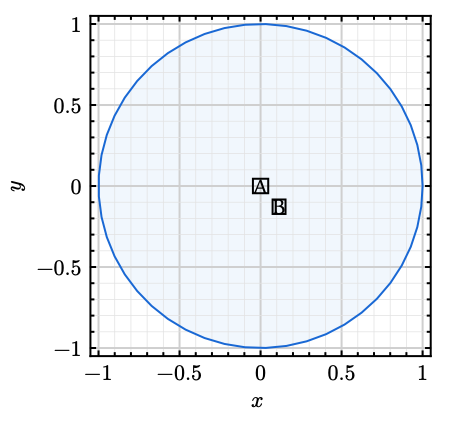
Why is box “B” placed the way it is? I would have expected the box to be with its southwest corner at (0,0).
#import "@preview/cetz:0.4.2": canvas, draw
#import "@preview/cetz-plot:0.1.3": plot

#canvas(length: 1cm, {
  let (cos, sin) = (calc.cos, calc.sin)
  let A = 1.05
  draw.set-style(axes: (
    minor-grid: (stroke: gray.lighten(70%) + 0.1pt)
  ))

  plot.plot(
    size: (6, 6),
    x-minor-tick-step: 0.1,
    y-minor-tick-step: 0.1,
    x-min: -A, x-max: A, x-tick-step: 0.5, x-grid: "both",
    y-min: -A, y-max: A, y-tick-step: 0.5, y-grid: "both",
    {
      plot.annotate({
        draw.content((0,0), box("A", stroke:1pt))
        draw.content((0,0), box("B", stroke:1pt), anchor:"south-west", padding:0)
      })
      plot.add(
        domain: (0, 2 * calc.pi),
        t => (cos(t), sin(t)),
        fill: true,
        style: (fill: blue.lighten(95%),
                stroke: blue)
      )
    }
  )
})
Someone smarter will have to correct me, but it seems "north" is towards negative y.
It works “as expected” if you flip the y-axis:
#import "@preview/cetz:0.4.2": canvas, draw
#import "@preview/cetz-plot:0.1.3": plot

#canvas(length: 1cm, {
  import calc: sin, cos
  let A = 1.05
  draw.set-style(axes: (
    minor-grid: (stroke: gray.lighten(70%) + 0.1pt)
  ))

  plot.plot(
    size: (6, 6),
    x-minor-tick-step: 0.1,
    y-minor-tick-step: 0.1,
    x-min: -A, x-max: A, x-tick-step: 0.5, x-grid: "both",
    y-min: A, y-max: -A, y-tick-step: 0.5, y-grid: "both",
    {
      plot.annotate({
        draw.content((0,0), box("A", stroke:1pt))
        draw.content((0,0), box("B", stroke:1pt), anchor:"south-west", padding:0)
      })
      plot.add(
        domain: (0, 2 * calc.pi),
        t => (cos(t), sin(t)),
        fill: true,
        style: (fill: blue.lighten(95%),
                stroke: blue)
      )
    }
  )
})
Sidenote:
Instead of manually assigning sin and cos, you can import them:
#canvas(length: 1cm, {
  import calc: sin, cos
  ...
1 Like
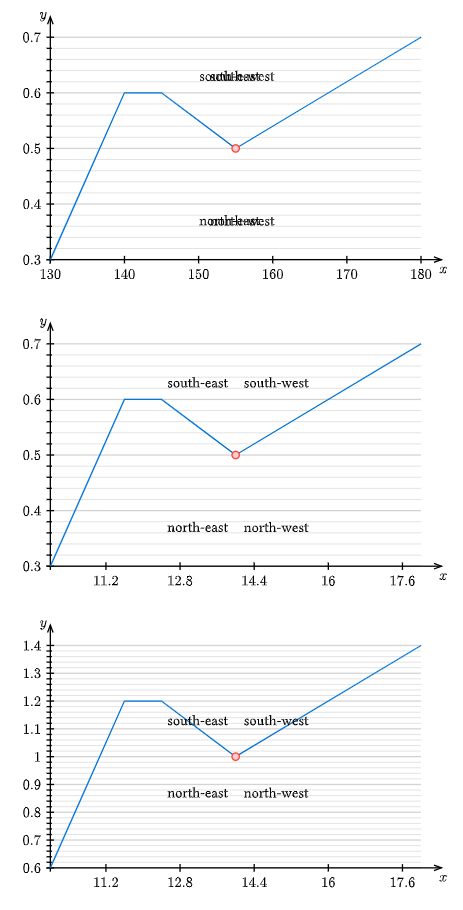
Argh, it seems like the anchor logic doesn’t behave well with content blocks in a cetz-plot.annotate function that tries to convert to plot coordinates.
#import "@preview/cetz:0.5.2"
#import "@preview/cetz-plot:0.1.4"

#let tryit(xmin, xmax, yscale) = {
    cetz.canvas({
        import cetz.draw: *
        import cetz-plot: plot

        plot.plot(
            size: (10, 6),
            y-grid: "both", y-min:0.3*yscale, y-max:0.7*yscale, y-tick-step:0.1, y-minor-tick-step:0.02,
            x-min:xmin, x-max:xmax, x-tick-step: (xmax - xmin)/5,

            name: "plot",
            axis-style: "school-book",
            {
                let v(a) = {xmin + (xmax - xmin) * a}
                plot.add(((v(0),0.3*yscale),(v(0.2),0.6*yscale),(v(0.3),0.6*yscale),(v(0.5),0.5*yscale),(v(1),0.7*yscale)))
                let mypoint = (v(0.5),0.5*yscale)
                plot.add((mypoint,), mark:"o")
                plot.annotate({
                    for anc in ("north-west", "north-east","south-west","south-east") {
                        content(mypoint, anc, anchor:anc)
                    }
                })
            }
        )
    })
}

#tryit(130, 180, 1)

#tryit(10, 18, 1)

#tryit(10, 18, 2)
I’ve opened Anchors don't work properly in annotation() context · Issue #187 · cetz-package/cetz-plot · GitHub