In anticipation of some work I might be doing in analytic combinatorics, I decided to toy around with Typst to see how up to scratch it was to make some more calculation-intensive plots. The below is the result.
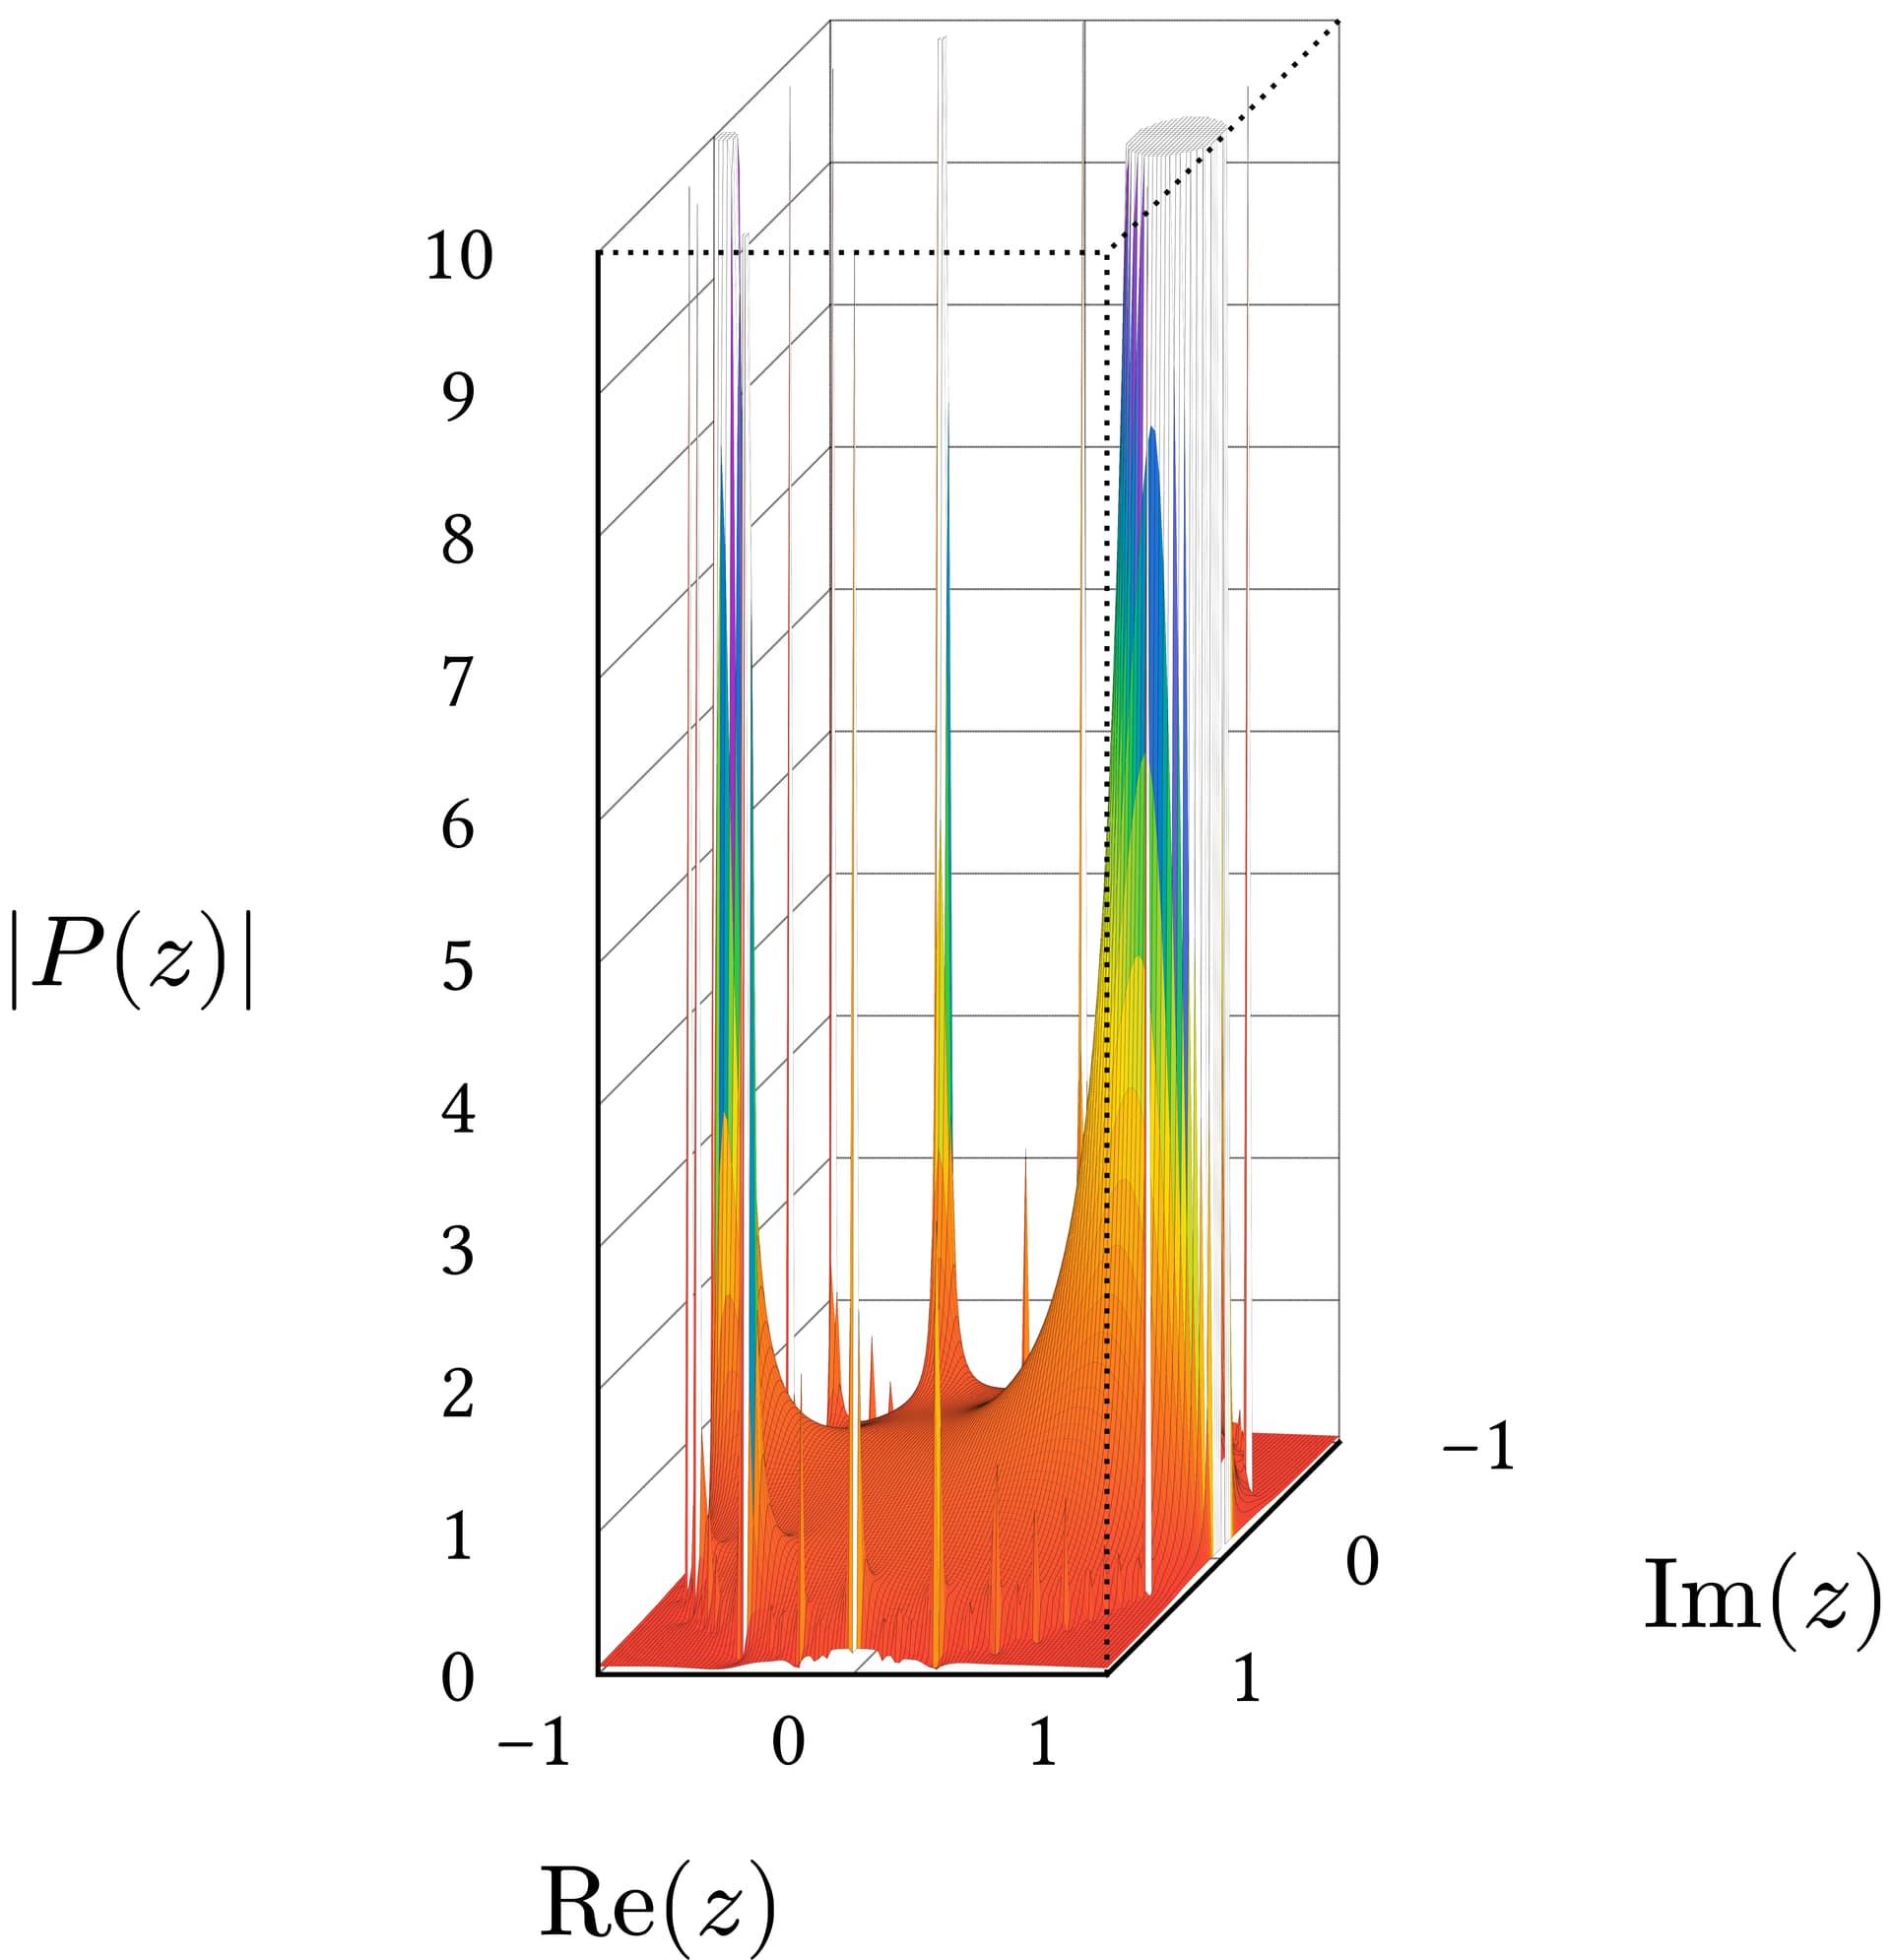
This is a plot of the Ordinary Generating Function (OGF) for integer partitions, with the plot being an attempt to replicate FIgure VIII.9 form “Analytic Combinatorics” by Flajolet and Sedgewick. The code itself is
#import "@preview/peano:0.2.1"
#import peano.number: complex as c

#import "@preview/plotsy-3d:0.2.1": *

#set page(
  width: auto,
  height: auto,
  margin: 0.1mm
)

// This file is used to create a 3D plot for complex saddle-point asymptotics for integer partitions

#{
  let n-term(n, z) = c.div(
    c.pow(z, n),
    c.mul(
      n,
      c.sub(
        c.from("1"),
        c.pow(z, n),
      )
    )
  )

  // Get exponent term
  let n-sum(n, z) = {
    let terms = range(1, n + 1, step: 1).map(k => n-term(k, z))
    terms.fold(c.from("0"), (acc, term) => c.add(acc, term))
  }

  // Euler's Number
  let eu = c.from("2.71828182845904")

  // Due to singularity issues, an upper bound parameter is needed to make plotting simpler
  let up-bound = 10.0

  let rainbow-grad = gradient.linear(
    red, orange, yellow, green, blue, purple,
    space: oklab
  )

  // Custom color function that samples from a rainbow gradient
  let rainbow-color-from-gradient(x, y, z, x-lo, x-hi, y-lo, y-hi, z-lo, z-hi) = {
    // Normalize z value to [0, 1]
    let z-normalized = if z-hi == z-lo { 0.5 } else { (z - z-lo) / (z-hi - z-lo) }

    // Check if point is at upper bound, and if so make it white, so as to represent poles
    if z == up-bound {
      return white
    }

    // Sample the gradient at the normalized z position
    return rainbow-grad.sample(z-normalized * 100%)
  }

  // Generating function formula. Uses the c.from(re, im) format for input complex number
  let OGF(zre, zim) = c.pow(eu, n-sum(15, c.from(zre, zim)))
  let OGFnorm(zre, zim) = {
    if float.is-nan(c.abs(OGF(zre, zim))) {
      up-bound
    }
    else if c.abs(OGF(zre, zim)) >= up-bound {
      up-bound
    }
    else {
      c.abs(OGF(zre, zim))
    }
  }
  let OGFphase(zre, zim) = c.arg(OGF(zre, zim))

  plot-3d-surface(
    OGFnorm,
    color-func: rainbow-color-from-gradient,
    subdivision-mode: "increase",
    subdivisions: 60,
    xdomain: (-1, 1),
    ydomain: (-1, 1),
    pad-low: (0,0,0),
    pad-high: (0,0,0),
    axis-step: (1, 1, 1),
    axis-labels: ([$"Re"(z)$], [$"Im"(z)$], [$|P(z)|$]),
    axis-label-size: 10em, // axes label text size
    axis-label-offset: (0.15, 0.15, 0.12), // axes label offsets
    dot-thickness: 0.2em, // background grid bar thickness
    front-axis-thickness: 0.5em, // Axes thickness
    xyz-colors: (black, black, black), // Axes colors
    rear-axis-text-size: 8em, // Grid numbers text sizze
    axis-text-offset: 0.05 // Grid numbers positioning away from grid box
  )
}
Running the code with the current parameters took 1 hour, so definitely not the kind of thing you want to rely on for ultimate precision, unless you want to surpass even LaTeX levels of compile time. Still, I’m fairly impressed with how well Typst handles itself. I’m also exceptionally pleased with the Peano and Plotsy packages, though Plotsy does leave things to be desired feature-wise. But hey, it did the job.
If I had the programming skills, I would prefer to make a package for 3D plotting which could support coloring based on level surfaces, rather than meshes, as the latter does lead to less than desirable artifacts near the poles.