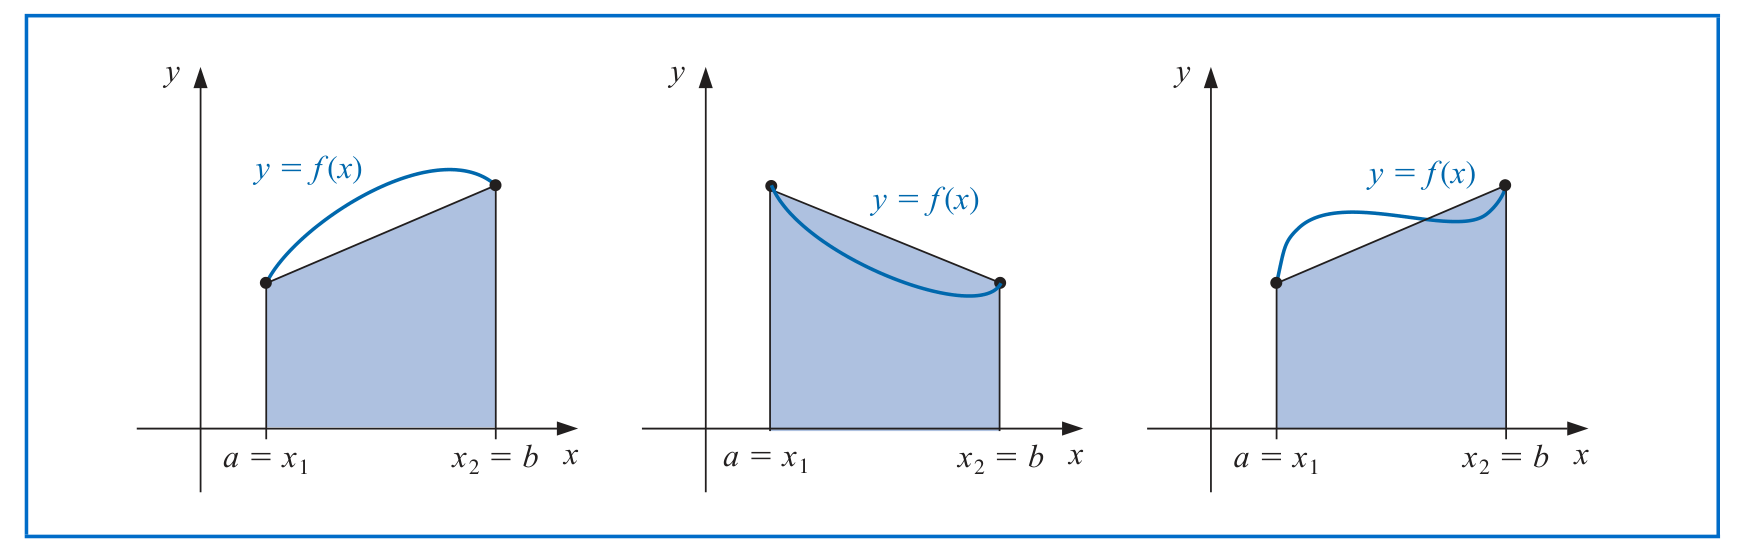
I am trying to generate the following figure but having a bit of trouble. My attempt is below, but I have a few problems with my attempt
- My way of generating the curve f(x) uses the sin function, and it’s not as flexible. Is there a way to make Bezier curves?
- I don’t know how to get 3 subfigures in a single figure.
Attemping to recreate the following:
My attempt
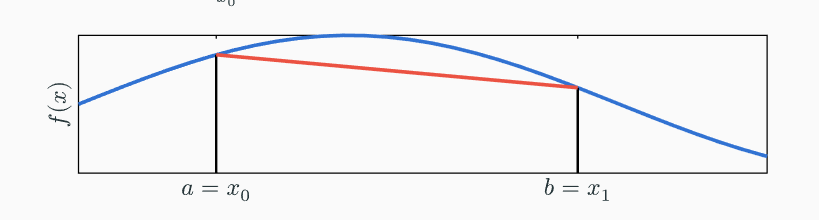
using
#import "@preview/cetz:0.4.2"
#import "@preview/cetz-plot:0.1.3": chart, plot
#cetz.canvas({
      import cetz.draw: *
      plot.plot(
        size: (20, 4),
        x-min: 0,
        x-max: 4,
        y-label: $f(x)$,
        x-label: none,
        axis-style: "scientific",
        y-tick-step: none,
        x-tick-step: none,
        x-ticks: (
          (0.8, [$a = x_0$]),
          (2.9, [$b  = x_1$]),
        ),
        //axis-style: none,
        {
          // Using an array of points:
          // Sampling a function:
          plot.add(domain: (0, 2 * calc.pi), calc.sin, style: (
            stroke: (paint: blue, thickness: 3pt),
          ))
          plot.add(((0.8, -1.0), (0.8, calc.sin(0.8))), style: (
            stroke: (paint: black, thickness: 2pt),
          ))
          plot.add(((2.9, -1.0), (2.9, calc.sin(2.9))), style: (
            stroke: (paint: black, thickness: 2pt),
          ))

          plot.add(((0.8, calc.sin(0.8)), (2.9, calc.sin(2.9))), style: (
          stroke: (paint: red, thickness: 3pt),
          ))
        },
      )
    })