Hello,
I want to work with typst to generate plots of series found in a csv file.
DO you have any ideas how to start that ?
I have read on cetz how to do it with canvas, but that’s just for defined functions before hand, my goal is to generate a series plot for every column in the csv file.
Thank you kindly.
i started with this example, but to no avail,
#import "@preview/cetz:0.3.2": canvas, draw
#import "@preview/cetz-plot:0.1.1": plot

#let results = csv("data.csv")
#let rows= results.first()

#canvas({
  import draw: *

  // Set-up a thin axis style
  set-style(axes: (stroke: .5pt, tick: (stroke: .5pt)),
            legend: (stroke: none, orientation: ttb, item: (spacing: .3), scale: 80%))

  plot.plot(size: (12, 8),
    {
      let domain = (auto, +auto) //or domain(-calc.inf, calc.inf)

      for i in range(1,results.len()) {
        plot.add(rows,results.at(i), domain: domain, label: // column header,
        style: (stroke: black))
      }

    })
})
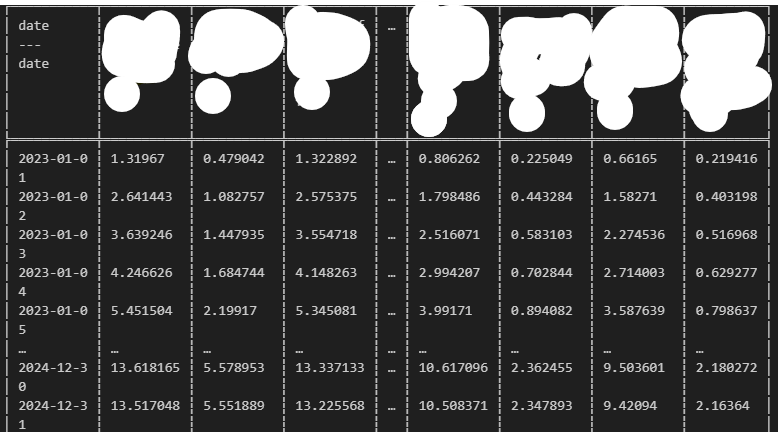
This is not a working example, just to start suggestion on how to make it work automatically, because I have 124k csv files , each one 24 dimensions with 16 rows.
Thanks team!
Can you post a small example of a data file? It’s not clear what are the x and y coordinates of points for the plot.
1 Like
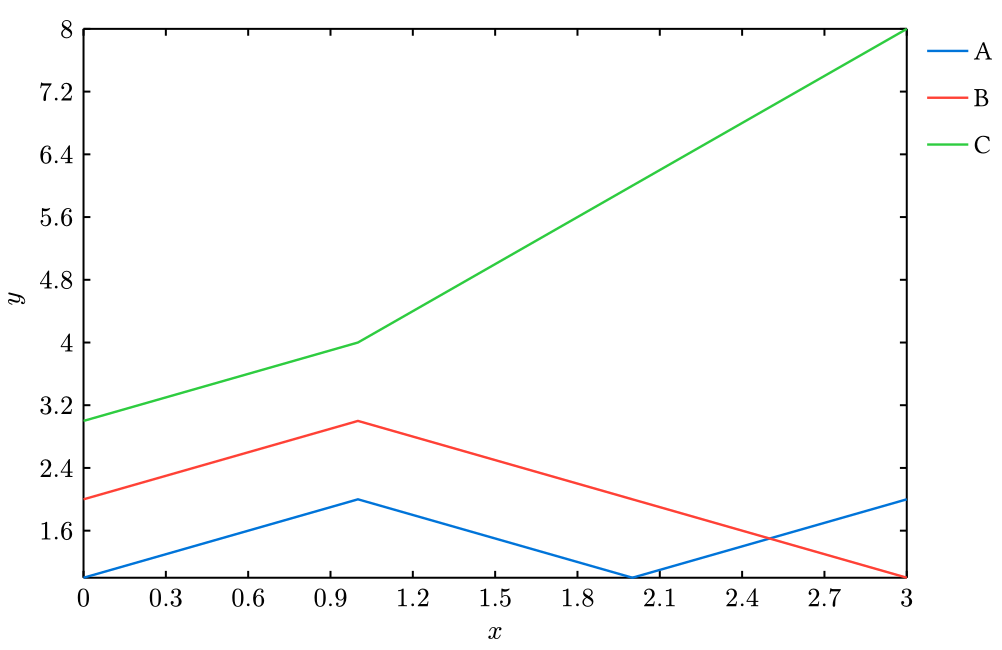
Here’s something to get you started:
#import "@preview/cetz:0.3.2": canvas, draw
#import "@preview/cetz-plot:0.1.1": plot

// Load CSV and separate first row from others
#let (names, ..data) = csv.decode(```
Date,A,B,C
2023-01-01,1,2,3
2023-01-02,2,3,4
2023-01-03,1,2,6
2023-01-04,2,1,8
```.text)

// Hack: use TOML parser to parse date strings
#let dates = data.map(x => toml.decode("date = " + x.first()).date)

// Each x value is the number of days since the first row date
#let xs = dates.map(x => (x - dates.first()).days())

// Make an array of (x, y) coordinates for the given column index
#let series(j) = range(data.len()).map(i => (xs.at(i), float(data.at(i).at(j))))

#canvas({
  import draw: *

  // Set-up a thin axis style
  set-style(
    axes: (stroke: .5pt, tick: (stroke: .5pt)),
    legend: (stroke: none, orientation: ttb, item: (spacing: .3), scale: 80%),
  )

  plot.plot(size: (12, 8), {
    for j in range(1, names.len()) {
      plot.add(series(j), label: names.at(j))
    }
  })
})
To load CSV data from a file, use #let (names, ..data) = csv("file.csv") instead.
2 Likes
You are a life saver!
What do I need to do to get each series in a graph, meaning a graph for A, B and C independently ?
edit:
I figured it out, You just bring out the for loop before calling canvas.
Thank you @sijo !
1 Like