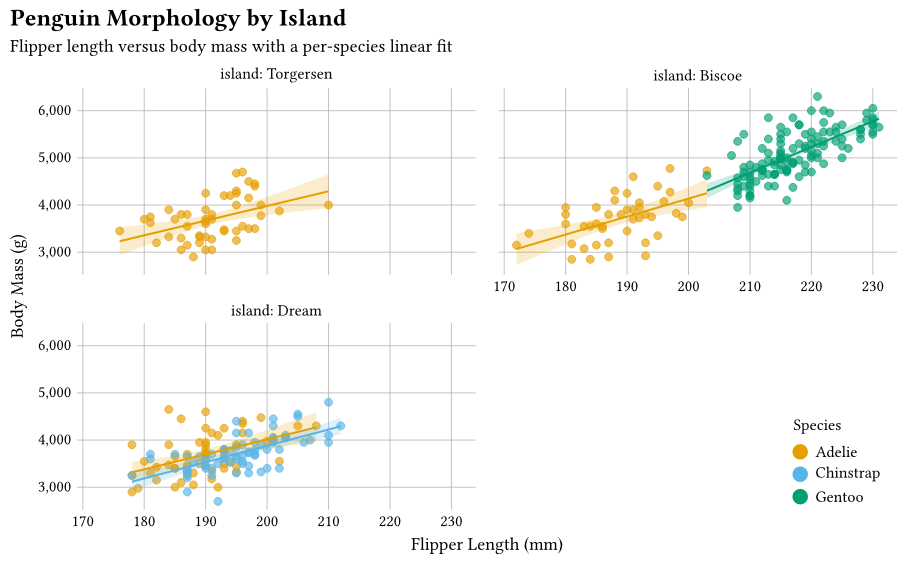
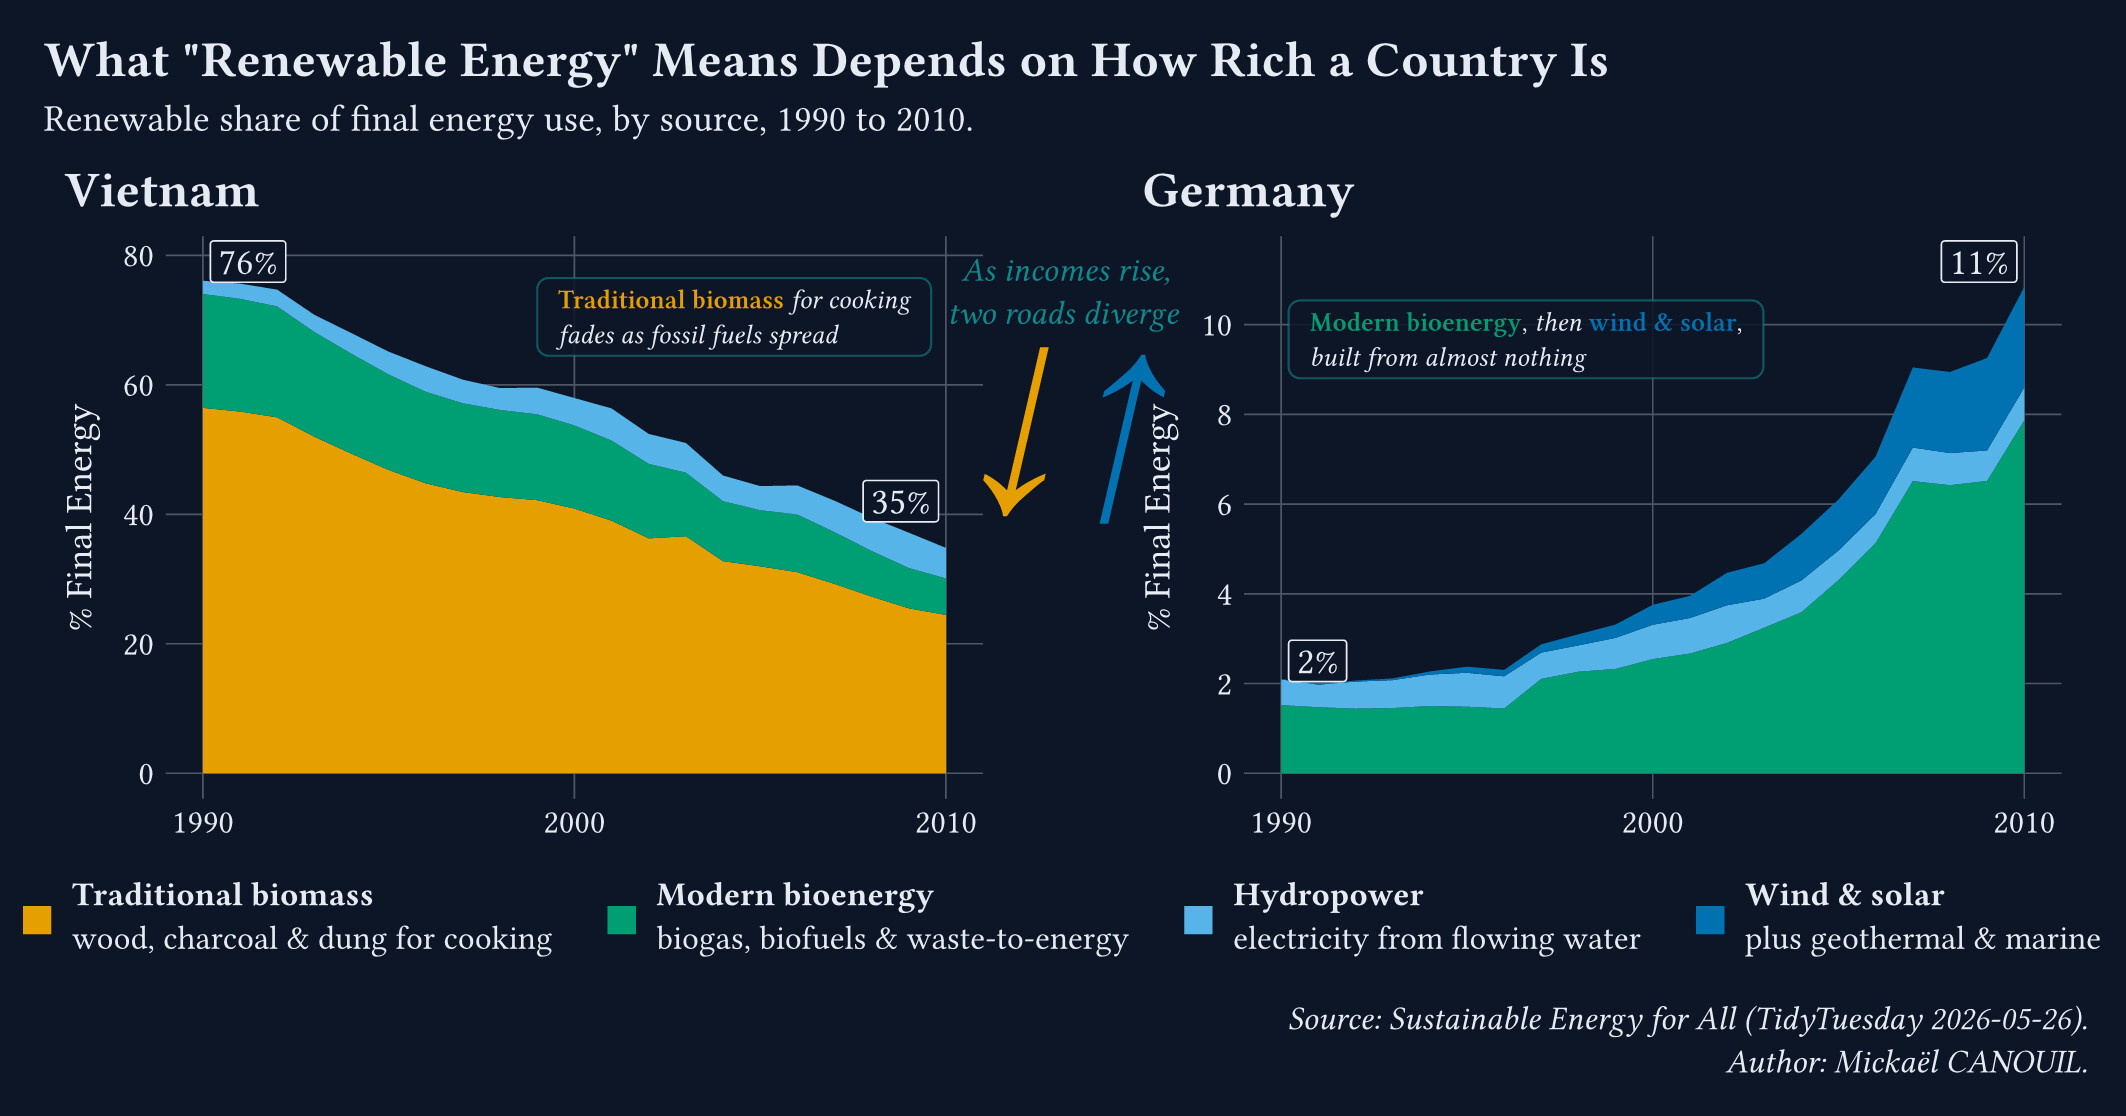
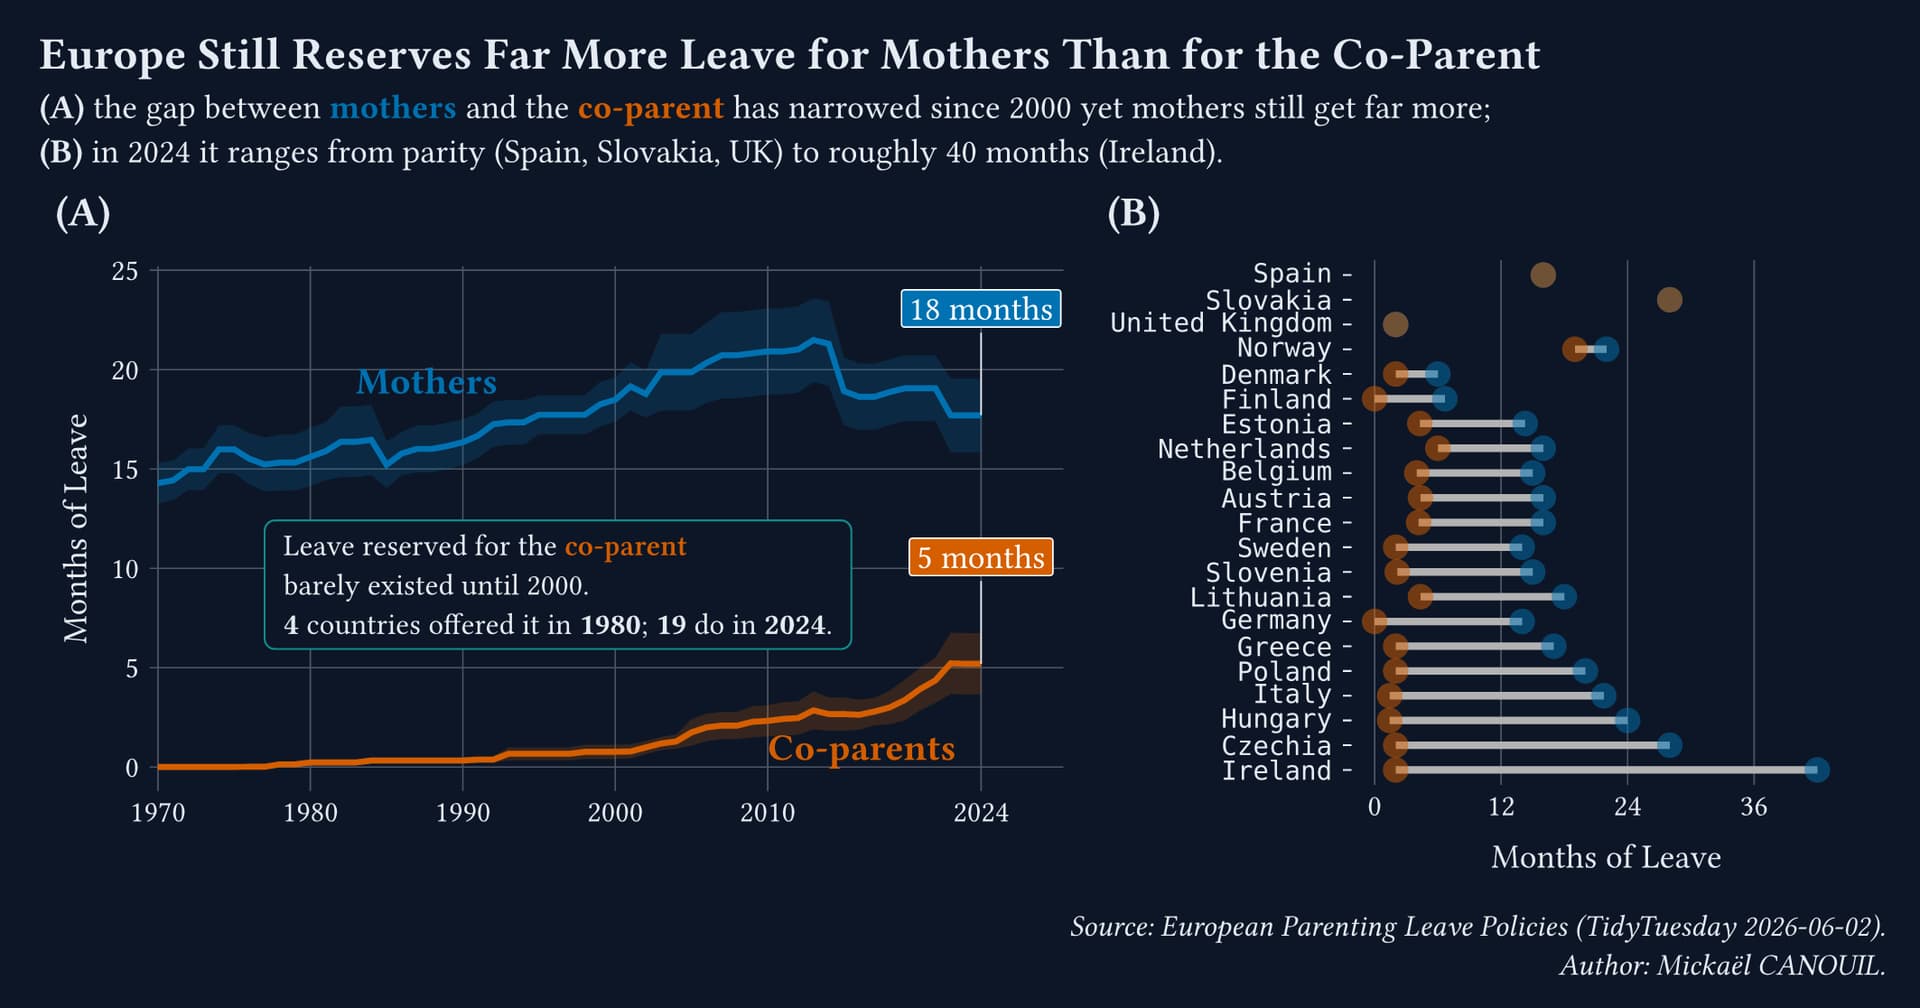
Gribouille (French for scribble ) is a new Typst package that brings Wilkinson’s grammar of graphics natively into Typst, in the spirit of ggplot2 and plotnine .
Gribouille uses cetz as backend.
The first version was released the 20th of May 2026.
Repository: GitHub - mcanouil/gribouille: Create elegant graphics with the Grammar of Graphics for Typst. · GitHub Gribouille
#import "@preview/gribouille:0.3.0": *

#set page(width: 16cm, height: 10cm, margin: 0cm)

#plot(
  data: penguins,
  mapping: aes(
    x: "flipper-len",
    y: "body-mass",
    colour: "species",
    fill: "species",
  ),
  layers: (
    geom-point(size: 2pt, alpha: 0.65),
    geom-smooth(method: "lm", alpha: 0.2),
  ),
  facet: facet-wrap("island", labeller: label-both()),
  scales: (scale-y-continuous(labels: format-comma()),),
  labs: labs(
    title: "Penguin Morphology by Island",
    subtitle: "Flipper length versus body mass with a per-species linear fit",
    x: "Flipper Length (mm)",
    y: "Body Mass (g)",
    colour: "Species",
    fill: "Species",
  ),
  theme: theme-minimal(),
  guides: guides(
    colour: guide-legend(position: bottom + right),
    fill: guide-legend(position: bottom + right),
  ),
  width: auto,
  height: auto,
)
16 Likes
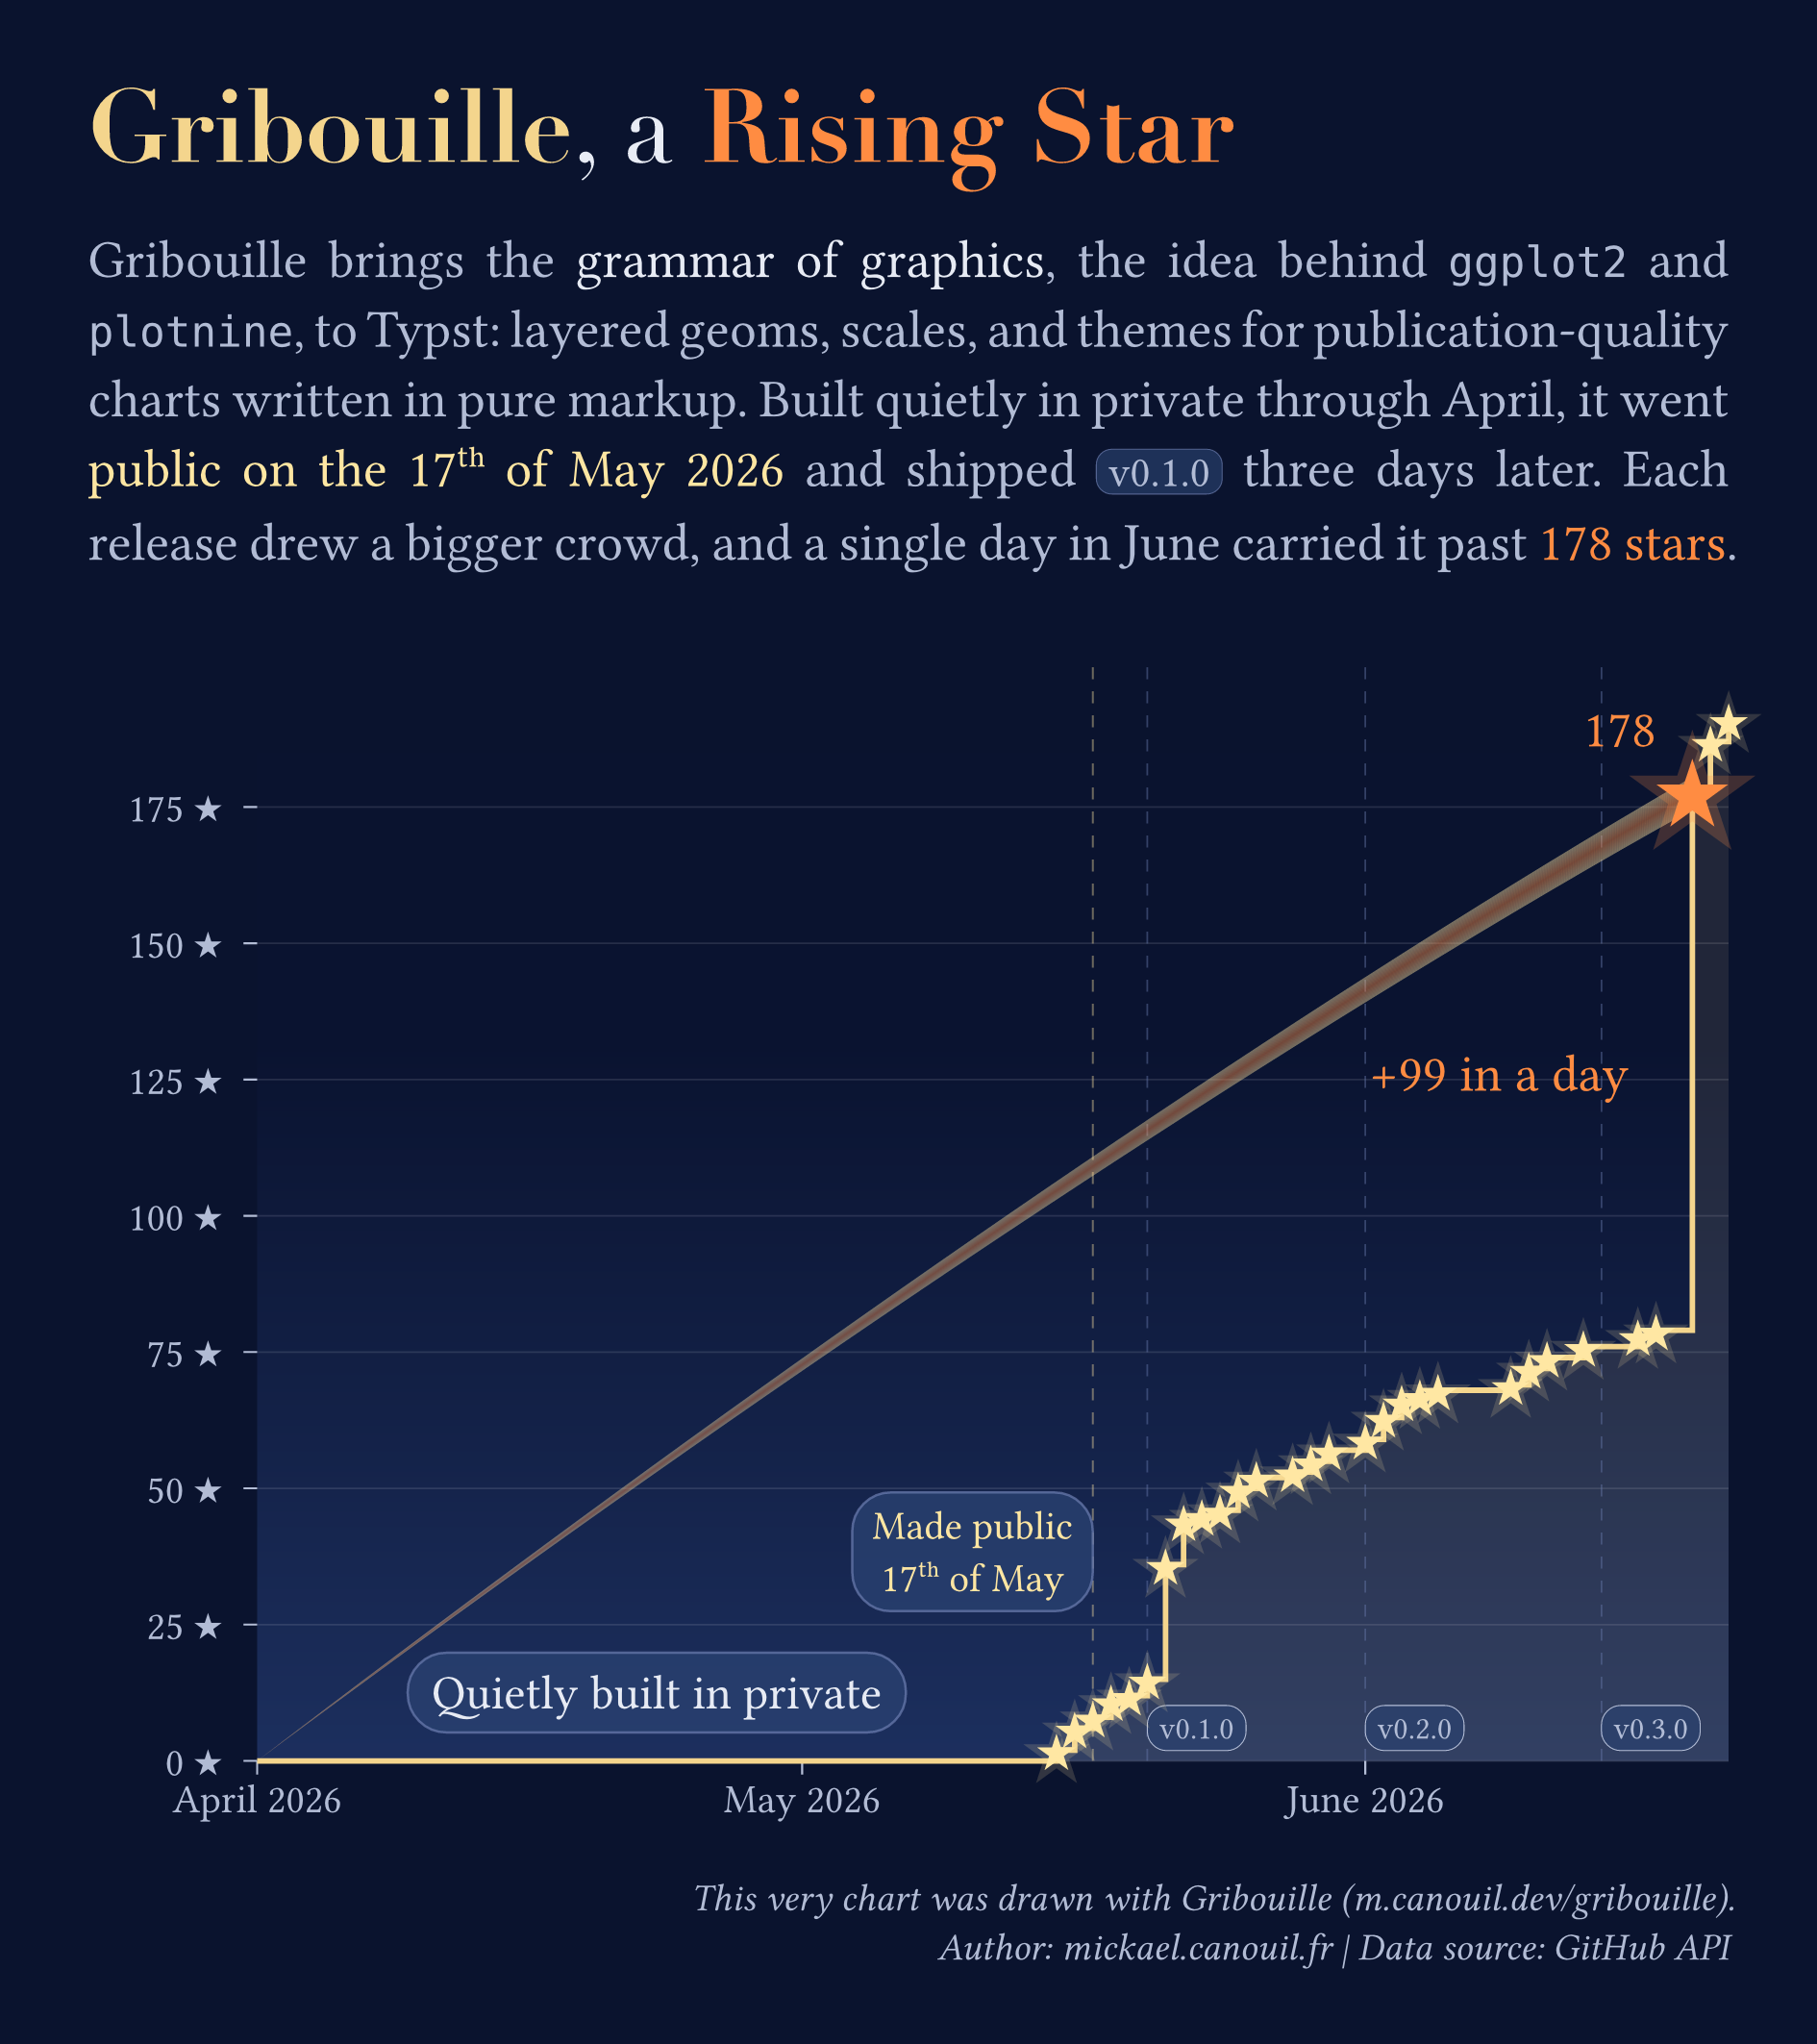
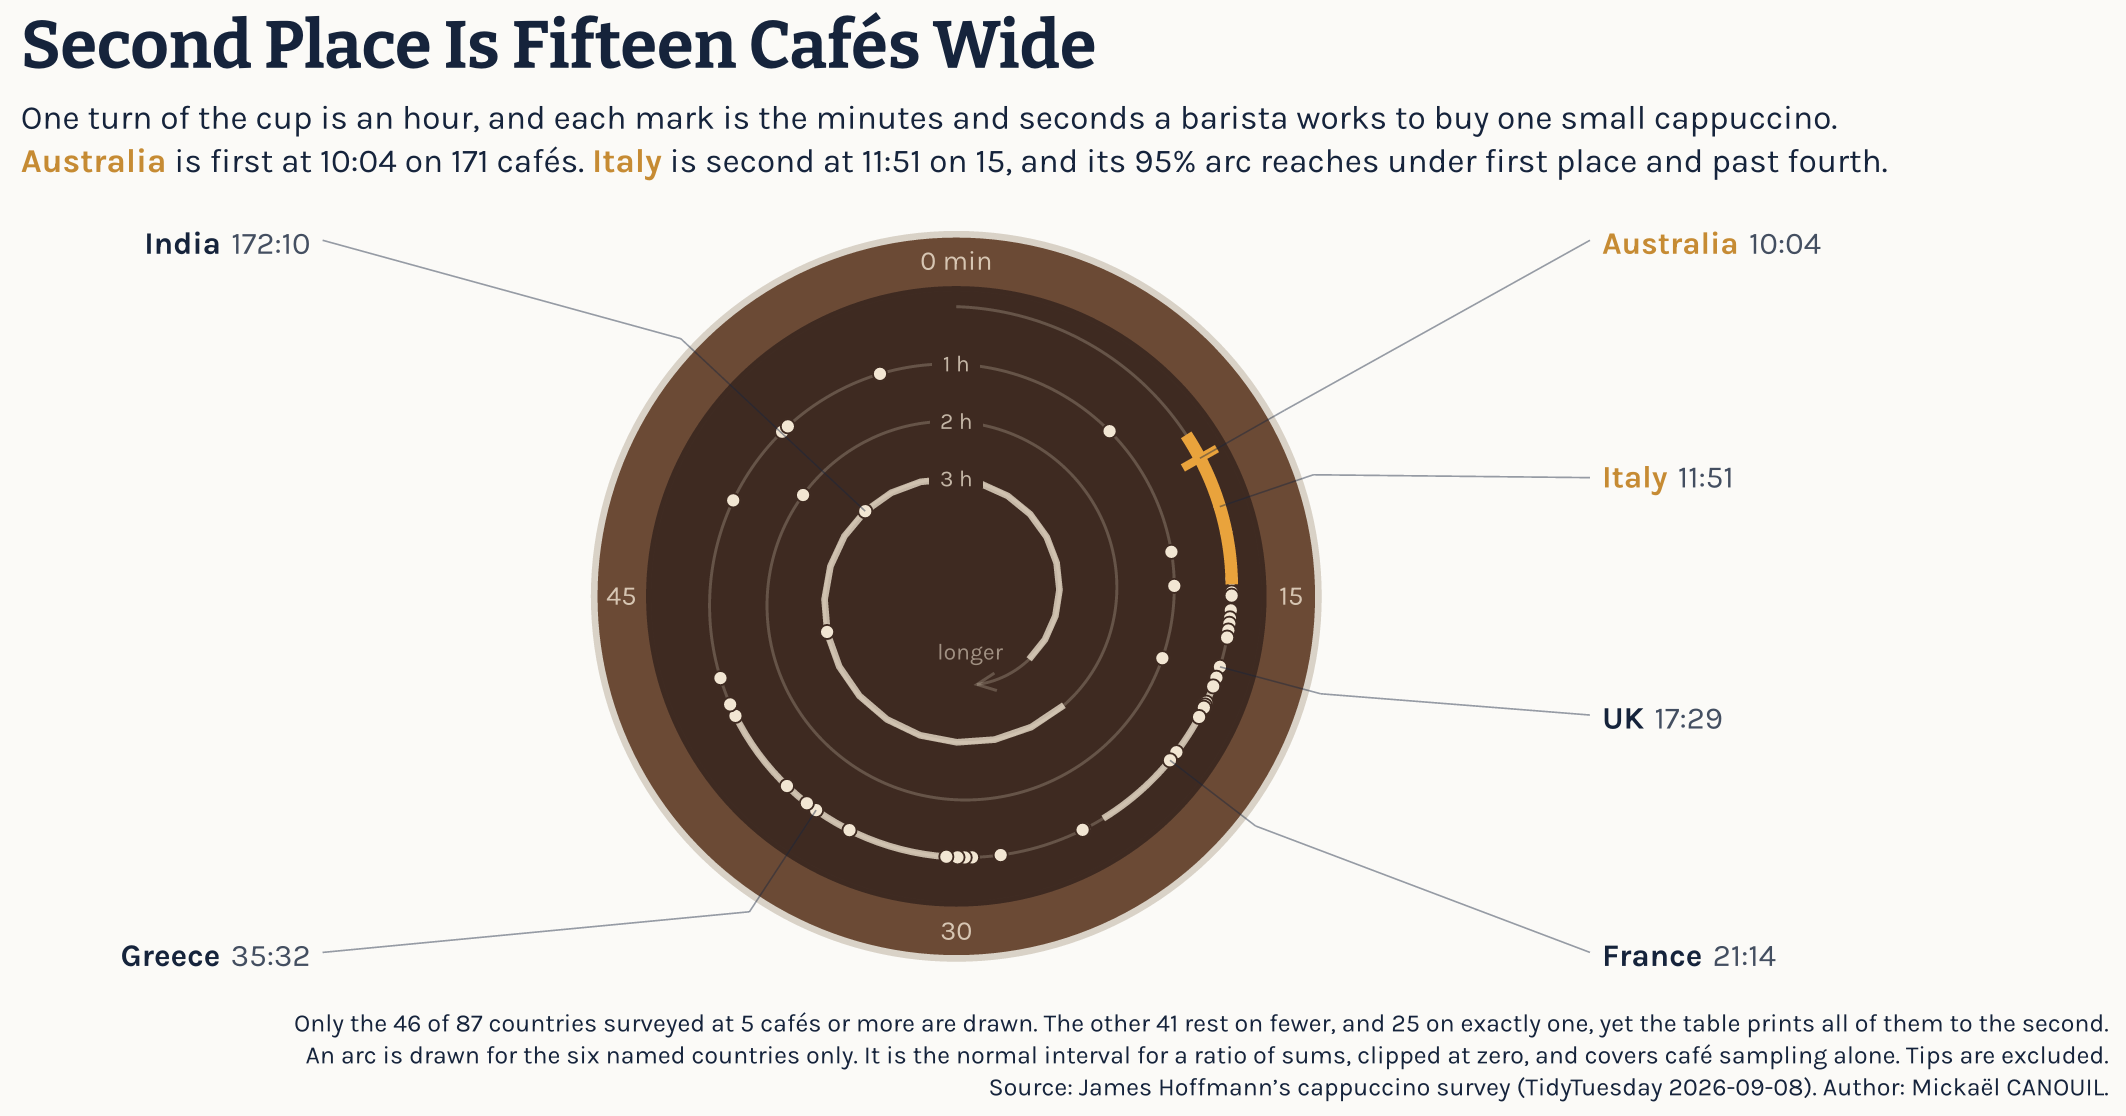
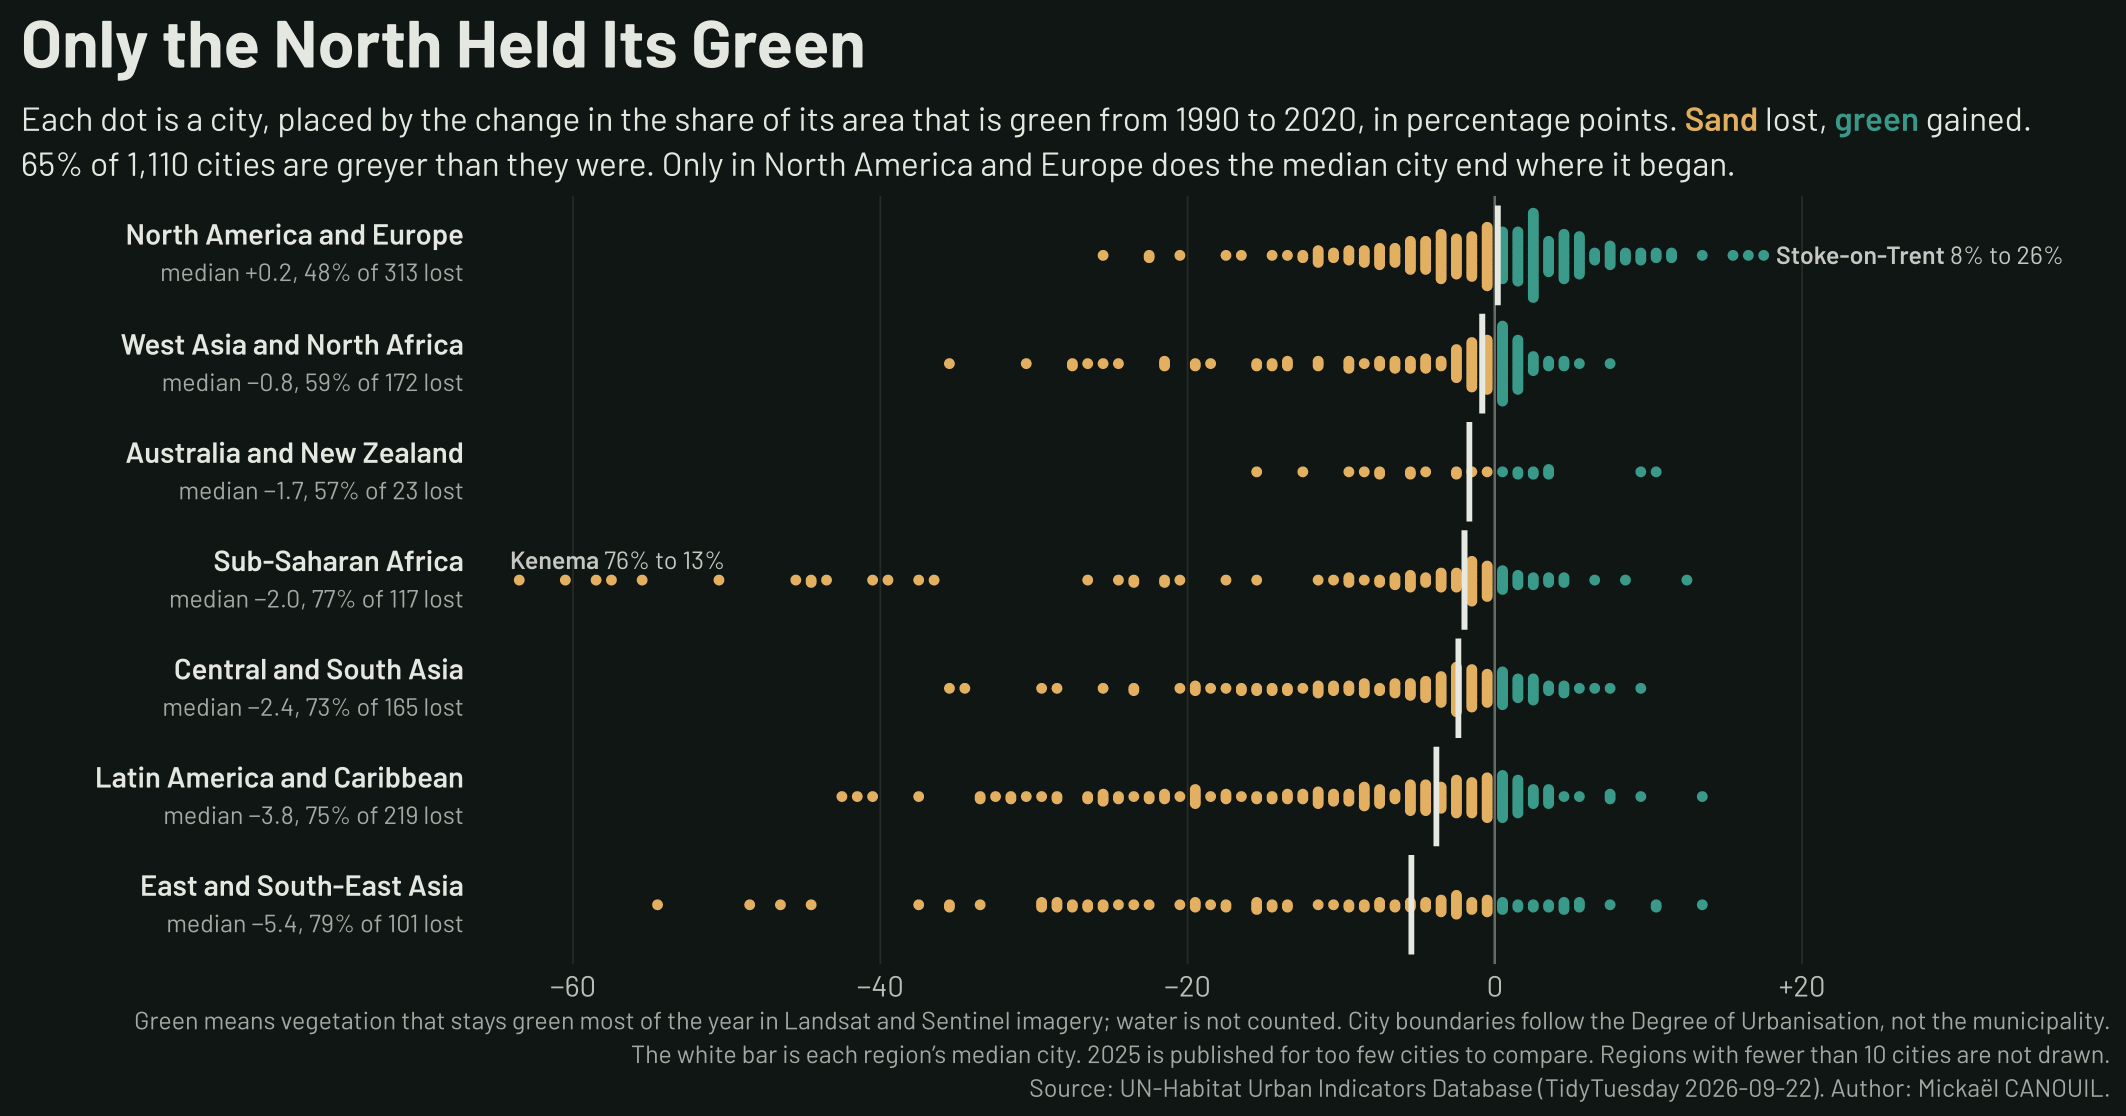
Every line, star, and gradient in this chart was drawn in Typst, with Gribouille plotting its own star history.
Gribouille 0.4.0 soon. Full source will ships with the announcement.
Midnight-sky line chart of Gribouille's cumulative GitHub stars per day from April to June 2026, titled "Gribouille, a Rising Star". A short caption notes the chart itself was drawn with Gribouille, the grammar of graphics for Typst. A luminous gold step trail rises from zero across a long flat run labelled "Quietly built in private", lifts at a gold dashed marker labelled "Made public 17th of May", then climbs through dashed release markers tagged v0.1.0, v0.2.0 and v0.3.0 to a final amber spike of 178 stars, annotated "+99 in a day". Each daily count is drawn as a small star glyph, and a gold shooting-star fan sweeps up into the peak. The y axis counts stars in steps of 25, each tick marked with a star; the x axis spans April, May and June 2026. 1890×2126 472 KB
2 Likes
This is very, very cool. Thanks for sharing!
2 Likes
Gribouille 0.4.0 on its way to Typst Universe.
Read the full announcement and get the code for the figure: Gribouille 0.4.0: Temporal Scales, Any-Glyph Markers, and a Finer Grid – Mickaël CANOUIL
2 Likes
This is excellent package, with impressive attention to details !
2 Likes
Release post: https://mickael.canouil.fr/posts/2026-07-13-gribouille-0-5/ )
LinkedIn: Gribouille 0.5.0 | Mickaël CANOUIL
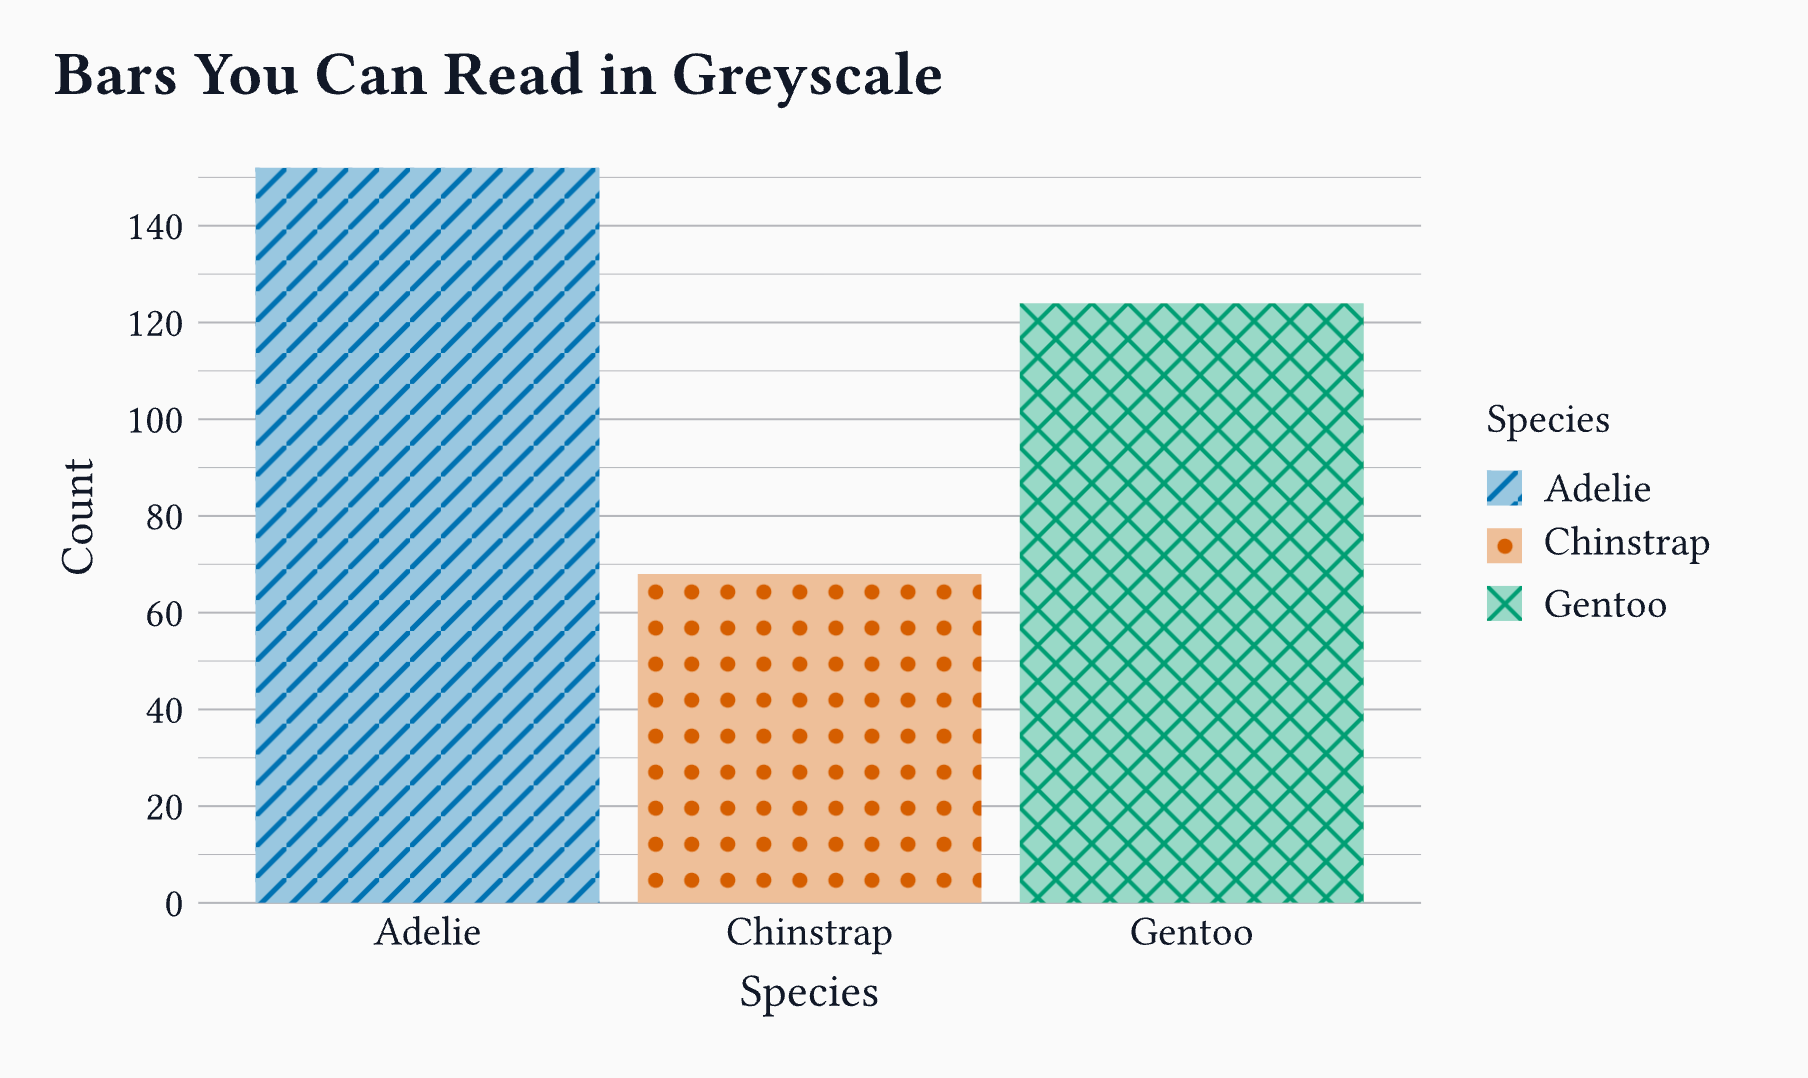
#import "@preview/gribouille:0.5.0": *

#let cb = (rgb("#0072B2"), rgb("#D55E00"), rgb("#009E73"))

#let stripes = tiling(size: (6pt, 6pt))[
  #place(rect(width: 100%, height: 100%, fill: cb.at(0).lighten(60%)))
  #place(line(start: (0%, 100%), end: (100%, 0%), stroke: 1pt + cb.at(0)))
]
#let dots = tiling(size: (7pt, 7pt))[
  #place(rect(width: 100%, height: 100%, fill: cb.at(1).lighten(60%)))
  #place(dx: 2pt, dy: 2pt, circle(radius: 1.5pt, fill: cb.at(1)))
]
#let cross = tiling(size: (7pt, 7pt))[
  #place(rect(width: 100%, height: 100%, fill: cb.at(2).lighten(60%)))
  #place(line(start: (0%, 100%), end: (100%, 0%), stroke: 0.8pt + cb.at(2)))
  #place(line(start: (0%, 0%), end: (100%, 100%), stroke: 0.8pt + cb.at(2)))
]

#plot(
  data: penguins,
  mapping: aes(x: "species", fill: "species"),
  layers: (geom-bar(),),
  scales: scales(fill: scale-manual(values: (stripes, dots, cross))),
  labels: labels(
    title: "Bars You Can Read in Greyscale",
    x: "Species",
    y: "Count",
    fill: "Species",
  ),
  theme: theme-minimal(),
  width: 12cm,
  height: 7cm,
)
4 Likes
Unified handling of axis ticks marks
Proper vertical alignment of text in various spaces
Documentation gaps filled
Experimental data wrangling verbs
Read the full announcement: https://mickael.canouil.fr/posts/2026-07-28-gribouille-0-6/
3 Likes
brand.yml support
better content measurements
draw arrows to highlight directions
performance improvements
Read the full announcement: https://mickael.canouil.fr/posts/2026-08-25-gribouille-0-7/
6 Likes