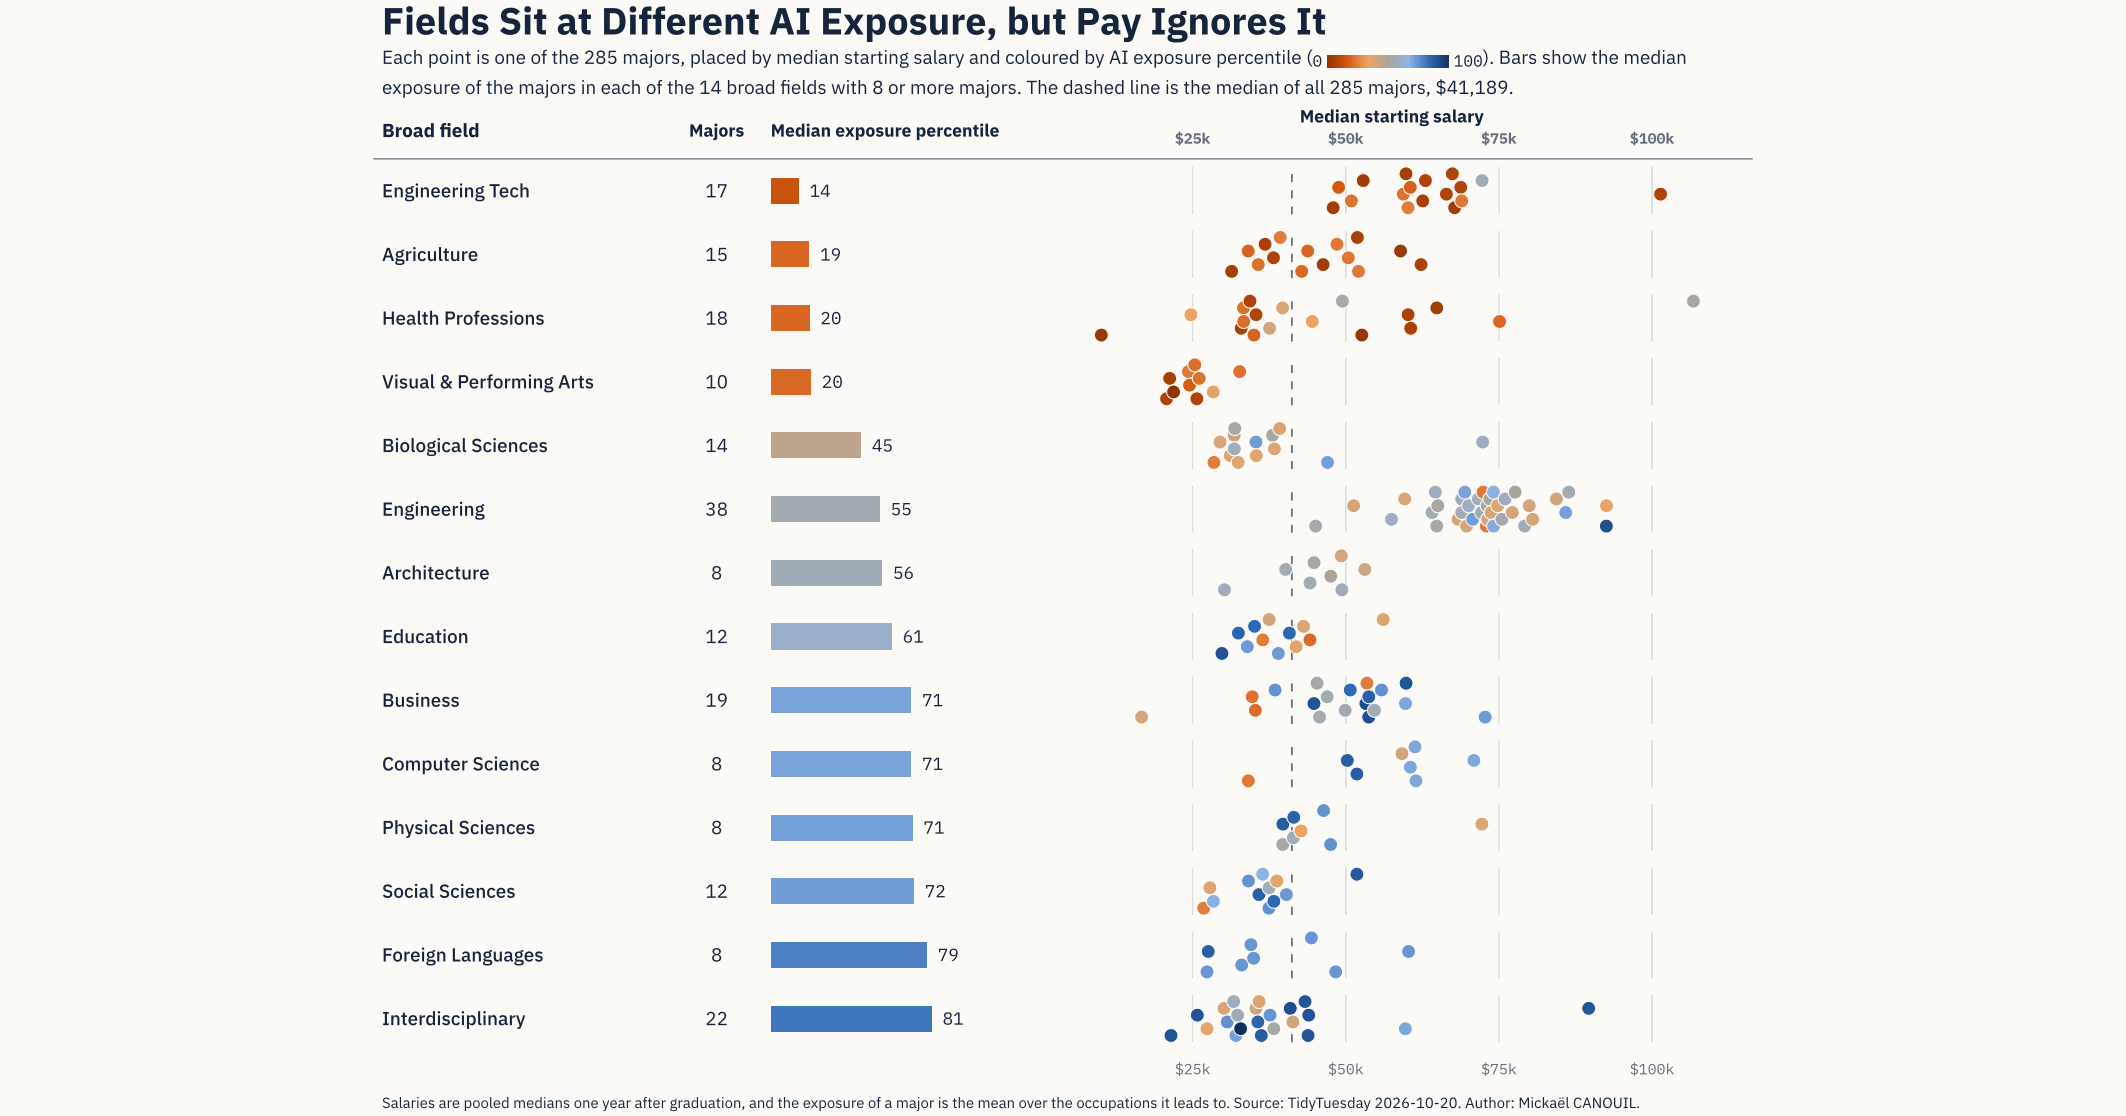
A table with one row for each of the 14 broad fields that have 8 or more majors, from the lowest median AI exposure percentile at the top to the highest at the bottom. Each row shows the field, its number of majors, a horizontal bar with the median exposure percentile, and a strip of one point for each major. Colour shows exposure percentile on a scale from orange for low exposure, through grey at the middle, to blue for high exposure, and the bars use the same colours. In the strips, the horizontal axis is median starting salary, from below $25k to above $100k, with the axis repeated under the last row. Light vertical guides mark $25k, $50k, $75k and $100k, and a dashed line marks the median of all 285 majors, $41,189. From the top: Engineering Tech, 17 majors, median 14. Agriculture, 15 majors, 19. Health Professions, 18 majors, 20. Visual & Performing Arts, 10 majors, 20. Biological Sciences, 14 majors, 45. Engineering, 38 majors, 55. Architecture, 8 majors, 56. Education, 12 majors, 61. Business, 19 majors, 71. Computer Science, 8 majors, 71. Physical Sciences, 8 majors, 71. Social Sciences, 12 majors, 72. Foreign Languages, 8 majors, 79. Interdisciplinary, 22 majors, 81. The bars get longer from the top to the bottom, and their colour moves from orange to blue, but the strips show no such trend along the salary axis. All 17 Engineering Tech points and all 38 Engineering points sit to the right of the dashed line, although their medians are 14 and 55, and all 10 Visual & Performing Arts points, in a field whose median is 20, sit to its left. In 11 of the 14 fields, orange and blue points are mixed along the salary axis, with majors both below and above the 50th percentile of exposure. 2126×1116 236 KB