Heatmap table / conditionnal formatting

After a lot of work I made a heatmap table, but I’m sure it can be improved.
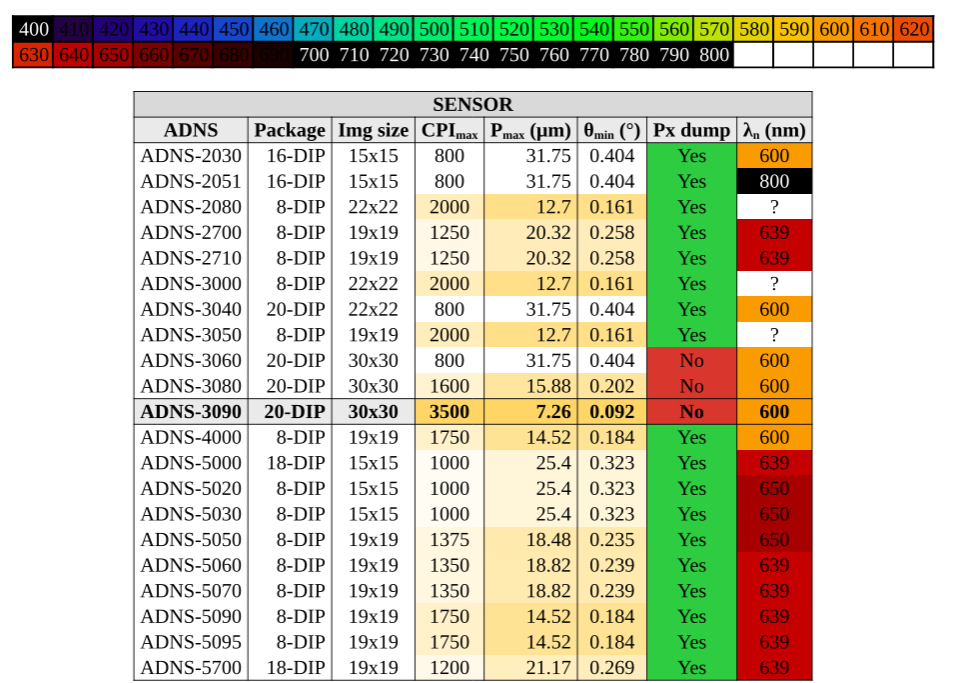
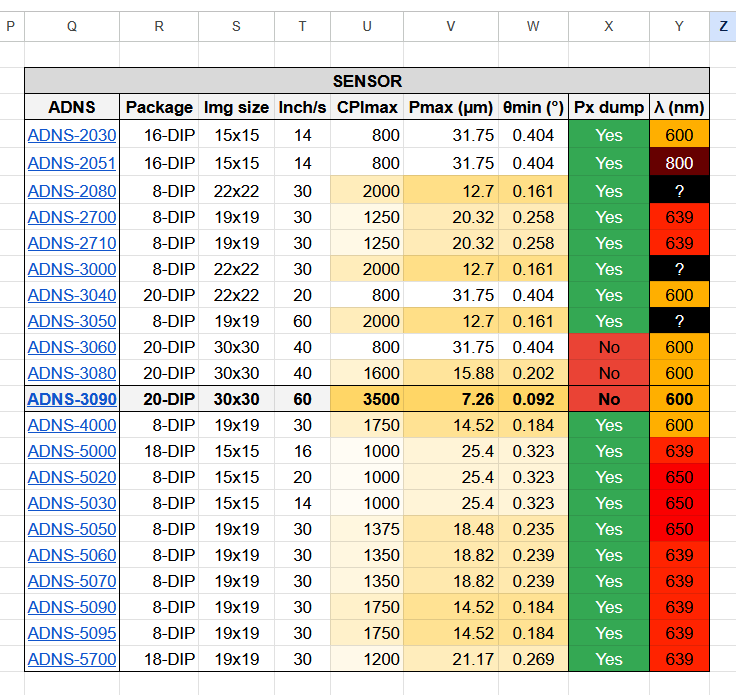
My goal was to replicate the “conditional formatting” from google sheets. Here is the table I wish to reproduce (note that the column PX dump has manual coloring):

First thing I did was to recreate the yellow gradient:

#let gsheet = gradient.linear(
      rgb("ffffff"),
      rgb("fff5d9"),
      rgb("ffebb3"),
      rgb("ffe18d"),
      rgb("ffd666"),
    )

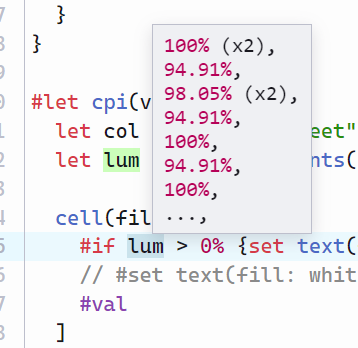
After a lot of searching, I found that you could sample a gradient at 0-100%, so I made a normalization function to normalize the cell value between 0 and 100%. In the case of the CPI_max column, min would be 800 and max would be 3500.

#let normalize(value, min, max) = {
  let n = (value - min) / (max - min) * 100
  n = calc.clamp(n, 0, 100)
  return n * 1%
}

And here comes the clunky part. I tried with dict but I couldn’t make it work. Since I wish to support the std color maps, I included them in the function:

#let colmap(map, value, min, max) = {
  let c = normalize(value, min, max)
  
  if map == "turbo" {return gradient.linear(..color.map.turbo).sample(c)}
  else if map == "cividis"  {return gradient.linear(..color.map.cividis).sample(c)}
  else if map == "rainbow"  {return gradient.linear(..color.map.rainbow).sample(c)}
  else if map == "spectral" {return gradient.linear(..color.map.spectral).sample(c)}
  else if map == "viridis"  {return gradient.linear(..color.map.viridis).sample(c)}
  else if map == "inferno"  {return gradient.linear(..color.map.inferno).sample(c)}
  else if map == "magma"    {return gradient.linear(..color.map.magma).sample(c)}
  else if map == "plasma"   {return gradient.linear(..color.map.plasma).sample(c)}
  else if map == "rocket"   {return gradient.linear(..color.map.rocket).sample(c)}
  else if map == "mako"     {return gradient.linear(..color.map.mako).sample(c)}
  else if map == "vlag"     {return gradient.linear(..color.map.vlag).sample(c)}
  else if map == "icefire"  {return gradient.linear(..color.map.icefire).sample(c)}
  else if map == "flare"    {return gradient.linear(..color.map.flare).sample(c)}
  else if map == "crest"    {return gradient.linear(..color.map.crest).sample(c)}
  else if map == "gsheet"   {return gsheet.sample(c)}
}

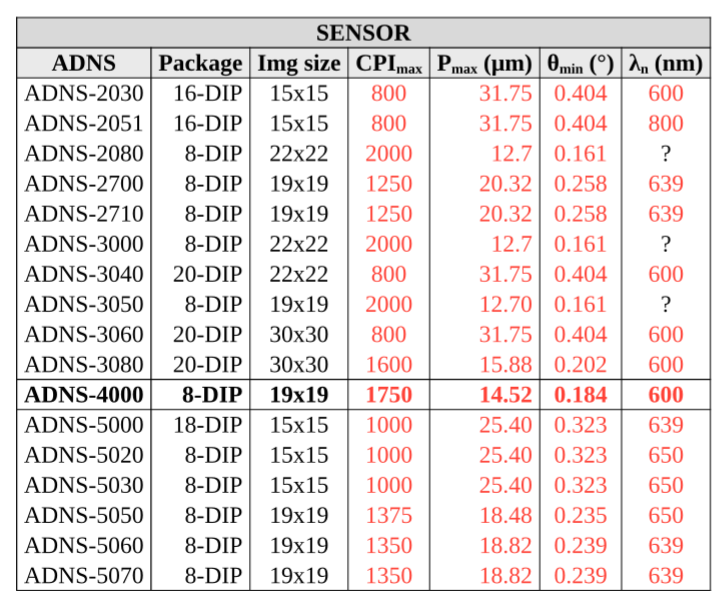
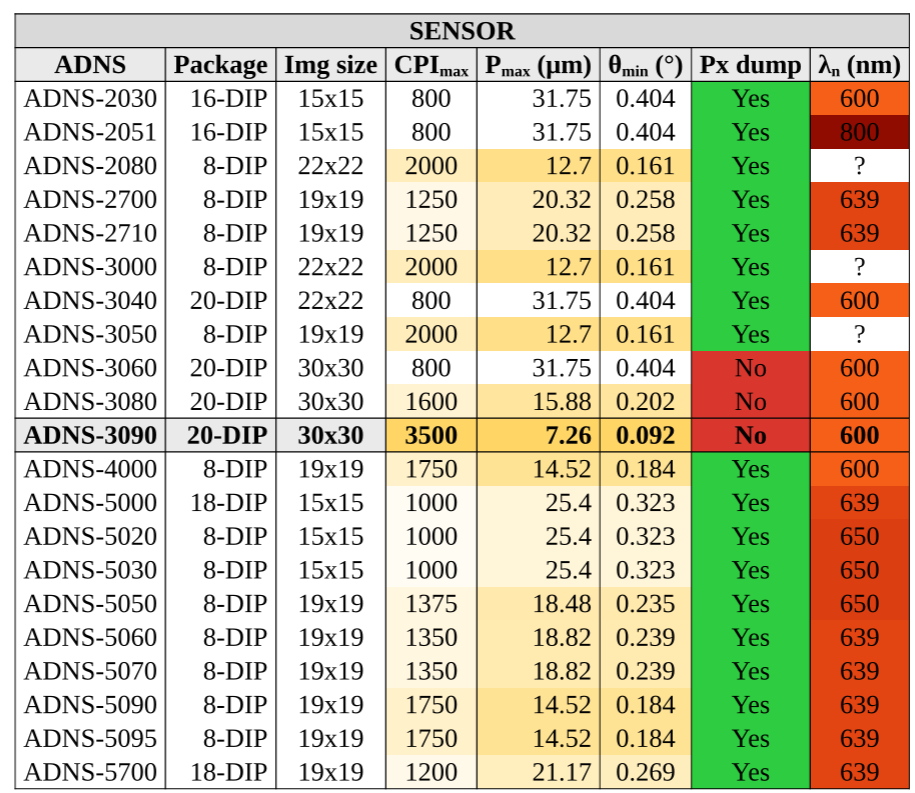
And finally the table:

#import table: cell, header, hline

#let yes = cell(fill: green)[Yes]
#let no = cell(fill: red.darken(15%))[No]
#let cpi(val) = cell(fill: colmap("gsheet", val, 800, 3500))[#val]
#let pm(val) =  cell(fill: colmap("gsheet", val, 31.75, 7.26))[#val]
#let tm(val) =  cell(fill: colmap("gsheet", val, 0.404, 0.092))[#val]
#let Ln(val) =  cell(fill: colmap("turbo", val, -200, 800))[#val]

#set table(
  fill: (x, y) =>
    if y == 0 { gray.lighten(55%) }
    else if y == 1 { gray.lighten(75%) },
   
  align: (x, y) => (
    if ((x == 1) or (x == 4)) and (y > 1) { right }
    else { center }
  )
)

#show table.cell.where(y: 0): set text(weight: "bold")
#show table.cell.where(y: 1): set text(weight: "bold")
#show table.cell.where(y: 12): set text(weight: "bold")

#table(
  columns: 8,
  align: center + horizon,
  stroke: (x: linestrokewidth, y: none),
  hline(y: 0, stroke: (dash: "solid", thickness: linestrokewidth),),
  hline(y: 1, stroke: (dash: "solid", thickness: linestrokewidth),),
  hline(y: 2, stroke: (dash: "solid", thickness: linestrokewidth),),
  hline(y: 12, stroke: (dash: "solid", thickness: linestrokewidth),),
  hline(y: 13, stroke: (dash: "solid", thickness: linestrokewidth),),
  hline(y: 23, stroke: (dash: "solid", thickness: linestrokewidth),),
  
  // Header
  header(
    cell(colspan: 8)[SENSOR],
    [ADNS], [Package], [Img size], [CPI#sub[max]], [P#sub[max] (#sym.mu\m)], [#sym.theta#sub[min] (#sym.degree)], [Px dump], [#sym.lambda#sub[n] (nm)],
  ),
  
  // Data
  [ADNS-2030], [16-DIP], [15x15], cpi(800),  pm(31.75), tm(0.404), yes, Ln(600),
  [ADNS-2051], [16-DIP], [15x15], cpi(800),  pm(31.75), tm(0.404), yes, Ln(800),
  [ADNS-2080],  [8-DIP], [22x22], cpi(2000), pm( 12.7), tm(0.161), yes, [?],
  [ADNS-2700],  [8-DIP], [19x19], cpi(1250), pm(20.32), tm(0.258), yes, Ln(639),
  [ADNS-2710],  [8-DIP], [19x19], cpi(1250), pm(20.32), tm(0.258), yes, Ln(639),
  [ADNS-3000],  [8-DIP], [22x22], cpi(2000), pm( 12.7), tm(0.161), yes, [?],
  [ADNS-3040], [20-DIP], [22x22], cpi(800),  pm(31.75), tm(0.404), yes, Ln(600),
  [ADNS-3050],  [8-DIP], [19x19], cpi(2000), pm( 12.7), tm(0.161), yes, [?],
  [ADNS-3060], [20-DIP], [30x30], cpi(800),  pm(31.75), tm(0.404), no, Ln(600),
  [ADNS-3080], [20-DIP], [30x30], cpi(1600), pm(15.88), tm(0.202), no, Ln(600),
  cell(fill: gray.lighten(75%))[ADNS-3090], cell(fill: gray.lighten(75%))[20-DIP], cell(fill: gray.lighten(75%))[30x30], cpi(3500), pm(7.26), tm(0.092), no, Ln(600),
  [ADNS-4000],  [8-DIP], [19x19], cpi(1750), pm(14.52), tm(0.184), yes, Ln(600),
  [ADNS-5000], [18-DIP], [15x15], cpi(1000), pm( 25.4), tm(0.323), yes, Ln(639),
  [ADNS-5020],  [8-DIP], [15x15], cpi(1000), pm( 25.4), tm(0.323), yes, Ln(650),
  [ADNS-5030],  [8-DIP], [15x15], cpi(1000), pm( 25.4), tm(0.323), yes, Ln(650),
  [ADNS-5050],  [8-DIP], [19x19], cpi(1375), pm(18.48), tm(0.235), yes, Ln(650),
  [ADNS-5060],  [8-DIP], [19x19], cpi(1350), pm(18.82), tm(0.239), yes, Ln(639),
  [ADNS-5070],  [8-DIP], [19x19], cpi(1350), pm(18.82), tm(0.239), yes, Ln(639),
  [ADNS-5090],  [8-DIP], [19x19], cpi(1750), pm(14.52), tm(0.184), yes, Ln(639),
  [ADNS-5095],  [8-DIP], [19x19], cpi(1750), pm(14.52), tm(0.184), yes, Ln(639),
  [ADNS-5700], [18-DIP], [19x19], cpi(1200), pm(21.17), tm(0.269), yes, Ln(639),
))

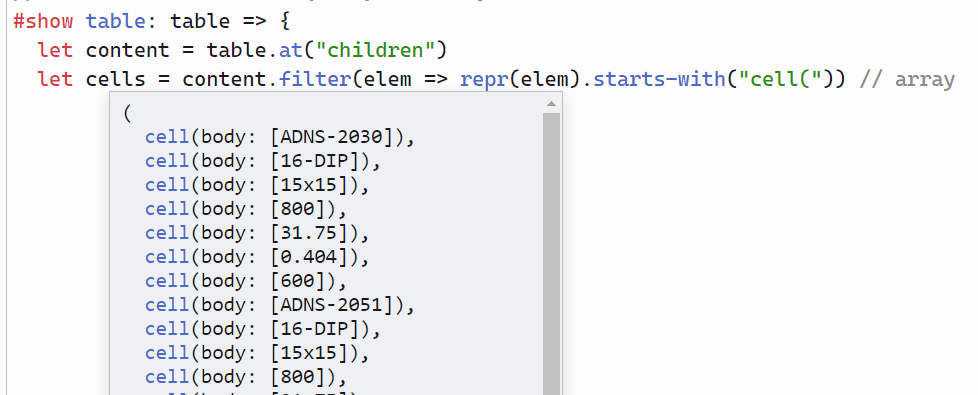
I think the way I did it is very bad, but I couldn’t find any resource online… The best would be a show rule or a set rule that applies directly on a column, something like this:

#set table(
  fill: (x, y) =>
     if x == 4 {colmap("gsheet", table.cell.body, 800, 3500)}
)

But I don’t know how to do that.

Also, the λ column is supposed to convey the color at that specific wavelength, but the normalization 400-800nm (infrared to ultraviolet) doesn’t work well on the std color maps like rainbow or turbo

2 Likes

After a bit of searching i found this stackoverflow answer for the color spectrum problem, which I implemented easily in Typst:

#let spectral_color(l) = { // <400,700> [nm]
    let t
    let r = 0
    let g = 0
    let b = 0
    
         if (l>=400) and (l < 410) { t = (l - 400)/(410-400); r =      (0.33*t)-(0.20*t*t) }
    else if (l>=410) and (l < 475) { t = (l - 410)/(475-410); r = 0.14         -(0.13*t*t) }
    else if (l>=545) and (l < 595) { t = (l - 545)/(595-545); r =     +(1.98*t)-(     t*t) }
    else if (l>=595) and (l < 650) { t = (l - 595)/(650-595); r = 0.98+(0.06*t)-(0.40*t*t) }
    else if (l>=650) and (l < 700) { t = (l - 650)/(700-650); r = 0.65-(0.84*t)+(0.20*t*t) }
         if (l>=415) and (l < 475) { t = (l - 415)/(475-415); g =              +(0.80*t*t) }
    else if (l>=475) and (l < 590) { t = (l - 475)/(590-475); g = 0.8 +(0.76*t)-(0.80*t*t) }
    else if (l>=585) and (l < 639) { t = (l - 585)/(639-585); g = 0.84-(0.84*t)            }
         if (l>=400) and (l < 475) { t = (l - 400)/(475-400); b =     +(2.20*t)-(1.50*t*t) }
    else if (l>=475) and (l < 560) { t = (l - 475)/(560-475); b = 0.7 -(     t)+(0.30*t*t) }

    r = r * 100%
    g = g * 100%
    b = b * 100%
    return color.rgb(r,g,b)
}

And sure enough it looks great :

1 Like

As for setting the cell text color based on the cell background color I did this:

#let cpi(val) = {
  let col = colmap("gsheet", val, 800, 3500)
  let lum = col.components().at(0) // get the cell color luminance (oklab color space )

  cell(fill: col)[
    #if lum > 50% {set text(fill: white)}
    // #set text(fill: white) <- this works well
    #val
  ]
}

But doesn’t work… And yet if i put the set text(fill: white) outside the if it works ?? and it should since the condition is true !! Does the set only applies to the if block ?

image

Yes, #set only applies within the block it’s used in. So if you place it inside an #if, it affects only the contents of that if. That’s why you need to write out #val both inside the if and the else, depending on the condition. Here’s how you can handle it with both approaches:

Option 1: Using #set in each block

#let cpi(val) = {
  let col = colmap("gsheet", val, 800, 3500)
  let lum = col.components().at(0)

  cell(fill: col)[
    #if lum > 50% {
      #set text(fill: white)
      #val
    } else {
      #val
    }
  ]
}

Option 2: Inline styling using text(…)

#let cpi(val) = {
  let col = colmap("gsheet", val, 800, 3500)
  let lum = col.components().at(0)

  cell(fill: col)[
    #if lum > 50% {
      text(fill: white)[#val]
    } else {
      #val
    }
  ]
}

The second version avoids using #set and might be cleaner if you’re only changing one property for a specific case.

Option 3: Conditional fill directly in text(…)

#let cpi(val) = {
  let col = colmap("gsheet", val, 800, 3500)
  let lum = col.components().at(0)

  cell(fill: col, 
    text(fill: if lum > 50% { white } else { black }, [#val])
    )
}
1 Like

I think this works to look up color maps by name - it uses knowledge of the trick to turn a module into a dictionary:

#let colmap(map, value, min, max) = {
  let c = normalize(value, min, max)
  
  if map == "gsheet" { return gsheet.sample(c) }
  else {
    let cmap = dictionary(color.map).at(map, default: none)
    if cmap == none { panic("No such colormap: " + map)}
    return gradient.linear(..cmap).sample(c)
  }
}

It’s limited by scope like @Mathemensch already mentioned. The following syntax, special for this purpose can be used here:

#set text(fill: white) if lum > 50%
2 Likes

Thank you both ! works like a charm.


Now, the solution I went with really bother me, so i’m trying to use show rules to target a column. I saw this forum post with a regex solution, so I tried targetting the numbers:

#show table: it => {
  show regex("^\d*\.?\d+$"): content => {
    show table.cell.where(body: content): set table.cell(fill: blue)
    set text(fill: red)
    content
  }
  it
}

The numbers are in red, but the cell color isn’t blue…

This would be my debugging tip, hover over the content in the editor to see what it captures:

bild

We see that it matches text (the digits, here from my example). There are no table cells inside the matching content, only text, so we can’t change the styling of table cells this way. The show table.cell rule is scoped, the same way set rules work, so the show rule only applies to the content you have below in the same block.

The pragmatic way would be to use a fill rule on the table that sets the fill color of specific columns you know have numbers.

I’m not sure if there is a good way to do this by table data - it would be neat if there was! - except if you put the table data in an array and use a smart table construction function that inspects the data while making the table.

You’re right, I tried with targetting the whole table:

#show table: table => {
  let content = table.at("children")
  let cells = content.filter(elem => repr(elem).starts-with("cell(")) // array
  ...
  table
}

I managed to extract the cells from the table, but I can’t find a way to extract the body…

The next thing would be

#set cell(fill: red) if cells.body.matches(regex("^\d*\.?\d+$")

also if I want to target the nth column, i’d have to mod(n) cells
Almost there…

Just mentioning this so the alternative is not missed.

Note that to set the background color of the third column (index 2), you do it like this:

#table(
  fill: (x, y) => if y > 0 and x == 2 { blue },
  ...
)

You also have cell x/y available for styling using show rules.

This is the normal way to do it, but to do it by content is a challenge.

There might be a way, but it’s not laid up so that it can be done easily (or at all). Once the table cells are realized you can no longer set the fill property on them.


Edit: This is not great, but it’s a possible demo of styling digit cells separately. I didn’t find it possible to style table.cell by directly, because we don’t seem to be able to do so before the cells are already created (and fill can’t be changed).

So the workaround is to create a new table from the first table. We just have to avoid having the rule run multiple times. But the rule only applies to tables with a specific table, so it works out.

bild

#let digit-pat = regex("^\d*\.?\d+$")
#show <highlight-number-table>: it => {
  // find cells that are digits
  let digit-cells = it.children.filter(c => c.has("body") and c.body.text.match(digit-pat) != none).map(c => c.body)
  let f = it.fields()
  let _ = f.remove("label", default: none)
  let children = f.remove("children")

  let newcell(x, ..args) = {
    let f = x.fields()
    let body = f.remove("body")
    table.cell(..f, ..args, body)
  }
  let highlight-args = (fill: blue.lighten(50%))
  table(..f, ..children.map(x => {
    if x.func() == table.cell {
      if x.body in digit-cells {
        [#newcell(x, ..highlight-args)<number-cell>]
      } else {
        x
      }
    } else {
      x
    }
  }))
}

// We can still set some properties of the number cells like this (not fill)
#show <number-cell>: set text(red)

#table(columns: 2,
  table.header([A], [B]),
  [Rate], [1.00],
  [Score], [3.02])<highlight-number-table>
1 Like

No yeah that’s my goal.

Thing is i don’t want to color in blue (that’s just a quick way to test things), i need to colmap(map, <cell body>, min, max) so I need the body of the cell…

I think using a custom function to create the table is the best way to go. Have a function that takes separate arrays for Cpi, Pm etc columns and you colormap them and put them in the table and it’s fine.