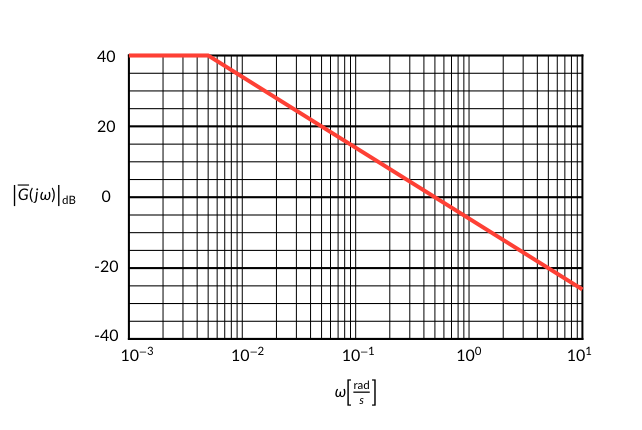
Hi,
I’m trying to replicate something similiar to this chart:
At the moment, I’ve done this, but I don’t know if it’s possibile to add two cetz axes and create a line between them. Any idea? Thanks a lot!

Hi,
I’m trying to replicate something similiar to this chart:
At the moment, I’ve done this, but I don’t know if it’s possibile to add two cetz axes and create a line between them. Any idea? Thanks a lot!

Currently, CeTZ doesn’t support specify position of plot, so we can’t directly add two plots in a single canvas.
But luckily, this can be done by grouping the second plot and setting it’s origin manually by group and set-origin.
Here is a example:
#import "@preview/cetz:0.3.1"
#import "@preview/cetz-plot:0.1.0"

#cetz.canvas(
  length: 72pt,
  {
    import cetz.draw: *
    import cetz-plot: *

    let common-x = 1

    plot.plot(
      name: "p1",
      x: 4,
      y: 4,
      size: (4, 2),
      asix-style: "scientific",
      {
        let f(x) = {
          if (x < -1.8) {
            40
          } else {
            -0.2 * calc.pow(x + 1.8, 2) + 40
          }
        }

        plot.add(
          domain: (-3, 3),
          f,
        )

        plot.add-anchor("p", (common-x, f(common-x)))
      },
    )

    group(
      name: "g2",
      {
        set-origin((0, -2.5))
        plot.plot(
          name: "plot",
          x: 4,
          y: 4,
          size: (4, 2),
          asix-style: "scientific",
          {

            let f(x) = -(calc.pow(calc.e, 2 * x) - 1) / (calc.pow(calc.e, 2 * x) + 1)

            plot.add(
              domain: (-3, 3),
              f,
            )

            plot.add-anchor("p", (common-x, f(common-x)))
          },
        )
      },
    )

    line("p1.p", "g2.plot.p", stroke: (dash: "dashed"))
  },
)
Wonderful, thanks! I Will share the code of the final results later.
    #import "@preview/cetz:0.3.1": canvas, draw
    #import "@preview/cetz-plot:0.1.0": plot
    #import "@preview/unify:0.6.0": num, qty, numrange, qtyrange

    #let phase-margin(
      xaxis: 1e-2,
      yaxis: -40,
      yaxis-scale: 20,
      points: ((1e-1, 40), (1, 20), (1e1, 20), (1e2, 0), (1e3, -20), (1e4, -60)),
      phase-yaxis: -180,
      phase-yaxis-scale: 90,
      phase-points: ((1e-1, 40), (1, 20), (1e1, 20), (1e2, 0), (1e3, -20), (1e4, -60)),
      critic-pulsation: 1e-2,
      critic-phase: -135,
      color: red,
    ) = {
      figure()[
        #set text(size: 8pt)
        #canvas(
          length: 1cm,
          {
            import draw: line, scale, content, circle
            draw.set-style(mark: (fill: black))
            draw.set-style(axes: (tick: (length:0, offset: -0.1cm)))
            draw.set-style(axes: (label: (angle:0deg, offset: 1cm)))

            plot.plot(
              size: (8, 5),
              name: "p1",
              axis-style: "scientific",
              y-tick-step: none,
              x-tick-step: none,
              x-max: 16,
              x-min: 0,
              y-min: 0,
              y-max: 16,
              x-label: none,
              y-label: $abs(overline(G)(j omega))_"dB"$,
              x-ticks: array.range(5).map(x=> (x*4,num("e" + str(calc.log(xaxis) + x).replace("−", "-")))),
              y-ticks: array.range(5).map(x=> (x*4,str(yaxis + yaxis-scale * x).replace("−", "-"))),
              {
                for i in range(0, 4) {
                  for j in range(1, 10) {
                    plot.add(
                      style: (stroke: (paint: black.lighten(50%), thickness: 0.25pt)),
                      ((i * 4 + calc.log(j) * 4, 0), (i * 4 + calc.log(j) * 4, 16)),
                    )
                  }
                }
                for i in range(0, 4) {
                  plot.add(style: (stroke: (paint: black.lighten(50%), thickness: 0.25pt)), domain: (0, 24), ((0, i * 4), (24, i * 4)))
                  for j in range(1, 5) {
                    plot.add(
                      style: (stroke: (paint: black.lighten(50%), thickness: 0.5pt)),
                      domain: (0, 24),
                      ((0, i * 4 + j), (24, i * 4 + j)),
                    )
                  }
                }

                if (points.len() > 0) {
                  plot.add(
                    style: (stroke: (paint: color, thickness: 2pt)),
                    points.map(p => {
                      return ((calc.log(p.at(0) / xaxis)) * 4, ((p.at(1) - yaxis) / yaxis-scale * 4))
                    }),
                  )
                }

                plot.add(
                  style: (stroke: (dash: "dashed", paint: color, thickness: 1pt)),
                    ((0,((0 - yaxis) / yaxis-scale * 4)),((calc.log(critic-pulsation / xaxis)) * 4,((0 - yaxis) / yaxis-scale * 4)))
                )

                plot.add-anchor("p", ((calc.log(critic-pulsation / xaxis)) * 4, ((0 - yaxis) / yaxis-scale * 4)))

              },
            )

            draw.group(
              name: "g2",
              {
                draw.set-origin((0, -6))
                plot.plot(
                  size: (8, 5),
                  name: "plot",
                  axis-style: "scientific",
                  y-tick-step: none,
                  x-tick-step: none,
                  x-max: 16,
                  x-min: 0,
                  y-min: 0,
                  y-max: 16,
                  x-label: none,
                  y-label: $angle overline(G)(j omega)$,
                  x-ticks: array.range(5).map(x=> (x*4,num("e" + str(calc.log(xaxis) + x).replace("−", "-")))),
                  y-ticks: array.range(5).map(x=> (x*4,str(phase-yaxis + phase-yaxis-scale * x).replace("−", "-"))) + ((((critic-phase - phase-yaxis) / phase-yaxis-scale * 4),$bold(phi_c)$,),),
                  {
                    for i in range(0, 4) {
                      for j in range(1, 10) {
                        plot.add(
                          style: (stroke: (paint: black.lighten(50%), thickness: 0.25pt)),
                          ((i * 4 + calc.log(j) * 4, 0), (i * 4 + calc.log(j) * 4, 16)),
                        )
                      }
                    }
                    for i in range(0, 4) {
                      plot.add(style: (stroke: (paint: black.lighten(50%), thickness: 0.25pt)), domain: (0, 24), ((0, i * 4), (24, i * 4)))
                      for j in range(1, 5) {
                        plot.add(
                          style: (stroke: (paint: black.lighten(50%), thickness: 0.5pt)),
                          domain: (0, 24),
                          ((0, i * 4 + j), (24, i * 4 + j)),
                        )
                      }
                    }

                    if (points.len() > 0) {
                      plot.add(
                        style: (stroke: (paint: color, thickness: 2pt)),
                        phase-points.map(p => {
                          return ((calc.log(p.at(0) / xaxis)) * 4, ((p.at(1) - phase-yaxis) / phase-yaxis-scale * 4))
                        }),
                      )
                    }

                    plot.add(
                      style: (stroke: (dash: "dashed", paint: color, thickness: 1pt)),
                        ((0,((critic-phase - phase-yaxis) / phase-yaxis-scale * 4)),((calc.log(critic-pulsation / xaxis)) * 4,((critic-phase - phase-yaxis) / phase-yaxis-scale * 4)))
                    )

                    plot.add-anchor("p", ((calc.log(critic-pulsation / xaxis)) * 4, ((critic-phase - phase-yaxis) / phase-yaxis-scale * 4)))

                  },
                )
              },
            )
            line("p1.p", "g2.plot.p", stroke: (dash: "dashed",paint: color, thickness: 1pt),)
            circle("p1.p", radius: .075cm, stroke: color, fill: color)
            circle("g2.plot.p", radius: .075cm, stroke: color, fill: color)
            content((rel: (0.15,0.15),  to: "p1.p"),
            padding: .05,
            anchor: "south-west",
            $bold(omega_c)$,
            frame: "circle",
            fill: white,
            stroke: none,
            )
          },
        )
      ]
    }

#figure()[
  #phase-margin(xaxis: 1e-3, yaxis: -40, yaxis-scale: 20, points: ((1e-3,40),(1e-2,40),(1e-1,20),(1e-0,-20),(1e1,-60)), phase-yaxis: -180,phase-yaxis-scale:45,phase-points: ((1e-3,0),(1e-2,-45),(1e-1,-135),(1e-0,-180),(1e1,-180)), critic-pulsation: 3e-1, critic-phase: -157.5, color: rgb("#275caa"))
]
I’m not sure if this is a new feature or just missed in previous answers, but it seems that a group is not necessary, and you can just use set-origin between different plots.
#import "@preview/cetz:0.4.2": canvas, draw
#import "@preview/cetz-plot:0.1.2": plot

#canvas({
  import draw: *
  plot.plot(
    // x axis
    size: (5, 1.2),
    x-tick-step: none,
    x-label: none,
    // y axis
    y-tick-step: none,
    y-label: $Z(t)$,
    {
      plot.add(domain: (0, 10), x=>x*x+1, style: (stroke: blue))
    }
  )
  set-origin((0,-1.3)) // negative to add below
  plot.plot(
    // x axis
    size: (5, 1.2),
    x-tick-step: none,
    x-label: $t$,
    // y axis
    y-tick-step: none,
    y-label: $P(t)$,
    {
      plot.add(domain: (0, 10), x=>-calc.cos(x), style: (stroke: red))
    }
  )
})