Currently, CeTZ doesn’t support specify position of plot, so we can’t directly add two plots in a single canvas.
But luckily, this can be done by grouping the second plot and setting it’s origin manually by group and set-origin.
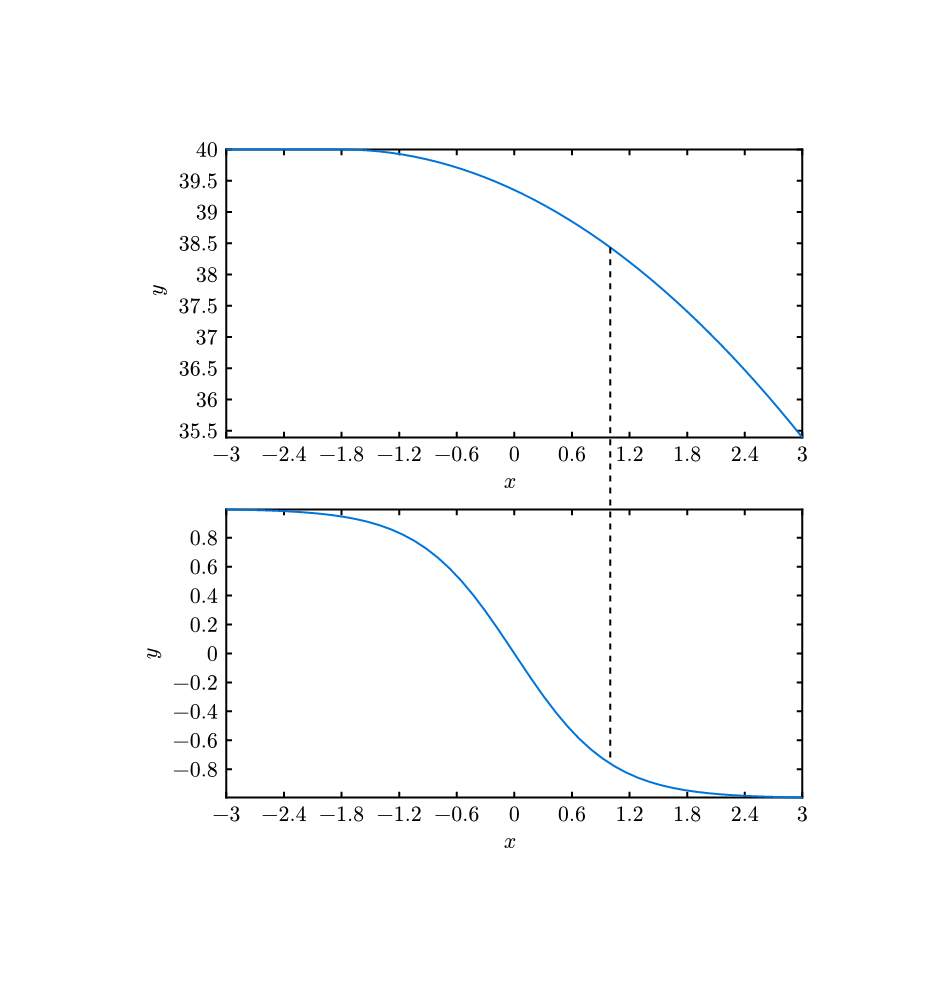
Here is a example:
#import "@preview/cetz:0.3.1"
#import "@preview/cetz-plot:0.1.0"

#cetz.canvas(
  length: 72pt,
  {
    import cetz.draw: *
    import cetz-plot: *

    let common-x = 1

    plot.plot(
      name: "p1",
      x: 4,
      y: 4,
      size: (4, 2),
      asix-style: "scientific",
      {
        let f(x) = {
          if (x < -1.8) {
            40
          } else {
            -0.2 * calc.pow(x + 1.8, 2) + 40
          }
        }

        plot.add(
          domain: (-3, 3),
          f,
        )

        plot.add-anchor("p", (common-x, f(common-x)))
      },
    )

    group(
      name: "g2",
      {
        set-origin((0, -2.5))
        plot.plot(
          name: "plot",
          x: 4,
          y: 4,
          size: (4, 2),
          asix-style: "scientific",
          {

            let f(x) = -(calc.pow(calc.e, 2 * x) - 1) / (calc.pow(calc.e, 2 * x) + 1)

            plot.add(
              domain: (-3, 3),
              f,
            )

            plot.add-anchor("p", (common-x, f(common-x)))
          },
        )
      },
    )

    line("p1.p", "g2.plot.p", stroke: (dash: "dashed"))
  },
)