Sadly that does not help at all.
It’s the same code as in your first post and still the same error.
I had to add .day()to the x-coordinates of the data points.
plot.add(series(j).map(x => {(x.at(0).day(), x.at(1))}), label: names.at(j))
If you want to show dates on the x-axis you can set custom x-ticks with a value and a label:
x-tick-step: none,
x-ticks: series(1).map(x => (x.at(0).day(), [#x.at(0).display("[month]-[day]")]))
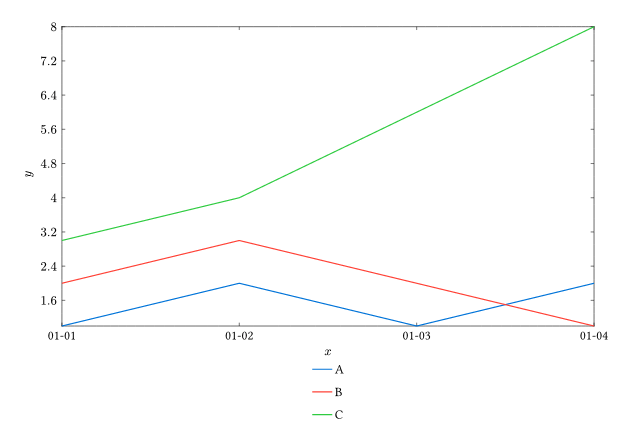
You can see the result here:
https://typst.app/project/rhSlsi9fLCvO02kqk9Vj5b