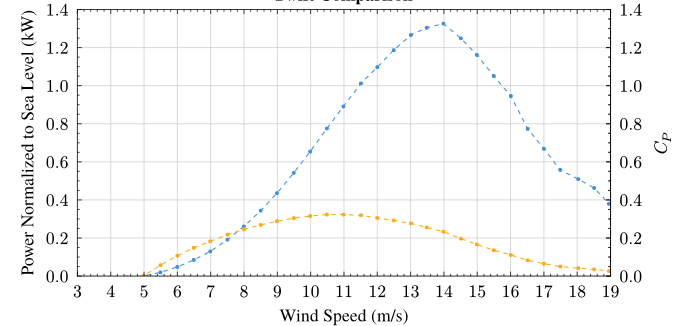
Hello, I am currently working on a plot in lilaq that has two plots in the same graph, however, I would like there to be two y axes. I currently have them as shown:
The issue is that I would like to have a different scale/range for the other y axis. In the documentation, they mapped the two axes together, such that they were linked. Is there a way for me to just manually dictate the range?
Hi @Zach_Selzman,
Can I attract your attention to Axis configuration − Lilaq which shows an example doing what I believe to be what you want.
1 Like
Oh I see, so you nestle it into the lq.yaxis, kinda embarrassing I missed that but thank you!
1 Like
Yes. With yaxis: (mirror: false), as well.
1 Like
@Zach_Selzman, if you are happy with the solution, please come back and mark  the post you consider the proper solution for your question.
1 Like
I appreciated your help. However, for those that stumble upon this in the future, if you are simply trying to make a custom range for the twin axis. It is super simple:
lq.diagram(
  yaxis: (mirror: false),
  width:5in,
  height:2.5in,
  xlim:(3,19), // These are the axis ranges for the primary axes
  ylim:(0,1.4),
  xaxis:(tick-distance:1),
  title:[],
  xlabel: [],
  ylabel:[],
  lq.plot(plot stuff here),
  lq.yaxis(
    position:right, // Sets up the twin axis
    lim: (0,.3), // Literally you just do this, I couldn't find it in the documentation though, probably just dumb haha.
    lq.plot(your plot stuff)
  )
)
2 Likes