Hey everyone,
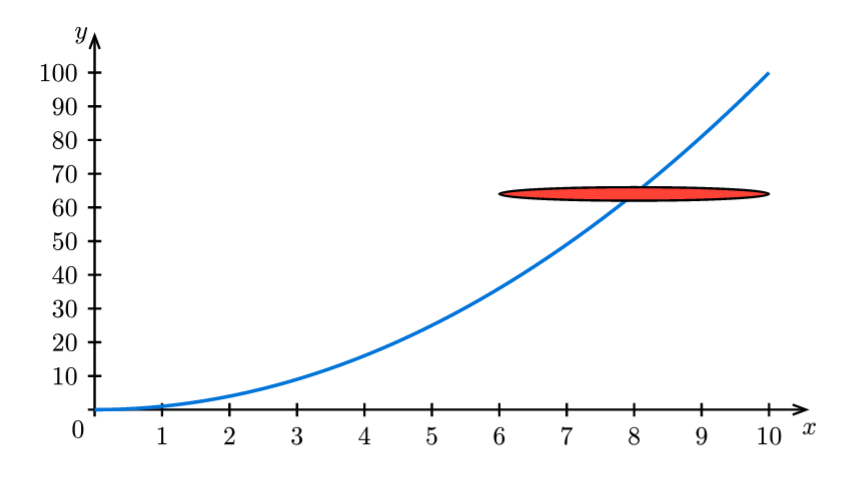
I’m working with plots in Typst and I’m running into an issue with annotations. When I add shapes like circles or rectangles using plot.annotate(), they get distorted if the x- and y-axes have different scales. This makes sense mathematically, but I’m wondering if there’s a way to keep shapes (especially circles) looking correct without manually adjusting their dimensions based on the axis ratio.
Does anyone have a good approach for this? I’ve put together a small example with code:
https://typst.app/project/rcrQ4svHRC346ata25RcZk
plot.plot(
      size: (10, 5),
      axis-style: "school-book",
      x-tick-step: 1,
      y-tick-step: 10,
      x-max: 10,
      y-max: 100,
      {
        plot.add(
          style: (stroke: blue + 1.5pt),
          domain: (0, 10),
          x => calc.pow(x, 2),
        )
        plot.annotate({
          circle((8, 64), radius: 2, fill: red)
        })
      },
    )
Would love to hear your thoughts!
Thanks!