Chris1
June 25, 2025, 10:19am
1
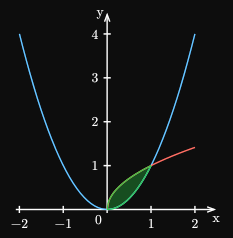
I would like to shade in the region between the two functions shown below
#import "@preview/cetz:0.3.4"
#import "@preview/cetz-plot:0.1.1"
#cetz.canvas({
  import cetz.draw: *
  import cetz-plot: *
  plot.plot(
    name: "a",
    size: (5,5),
    x-tick-step:1,
    y-tick-step:1,
    axis-style: "school-book",
    {
     plot.add(
   domain: (-2,2),
      x=>calc.pow(x,2),
  )
  plot.add(
      domain: (0,2),
      x=>calc.root(x,2)
    )
  }
  )
})
We can see an area between the two functions shown between (0,0) and (1,1).
How can I shade it in?
Thank you.
Andrew
June 25, 2025, 11:46am
2
With add-fill-between.
#import "@preview/cetz:0.4.0"
#import "@preview/cetz-plot:0.1.2"
#cetz.canvas({
  import cetz.draw: *
  import cetz-plot: *
  plot.plot(
    size: (5, 5),
    x-tick-step: 1,
    y-tick-step: 1,
    axis-style: "school-book",
    {
      plot.add(domain: (-2, 2), x => calc.pow(x, 2))
      plot.add(domain: (0, 2), x => calc.root(x, 2))
      plot.add-fill-between(
        domain: (0, 1),
        x => calc.pow(x, 2),
        x => calc.root(x, 2),
      )
    },
  )
})
2 Likes
Chris1
June 26, 2025, 4:00am
3
Thanks very much.
1 Like
Andrew
June 26, 2025, 3:03pm
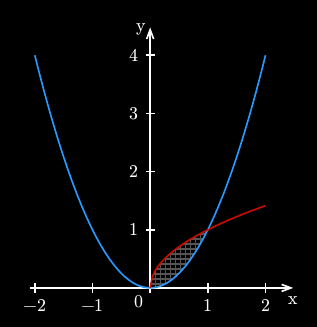
4
Use tiling
#import "@preview/cetz:0.4.0"
#import "@preview/cetz-plot:0.1.2"
#cetz.canvas({
  import cetz.draw: *
  import cetz-plot: *
  plot.plot(
    size: (5, 5),
    x-tick-step: 1,
    y-tick-step: 1,
    axis-style: "school-book",
    {
      plot.add(domain: (-2, 2), x => calc.pow(x, 2))
      plot.add(domain: (0, 2), x => calc.root(x, 2))
      plot.add-fill-between(
        domain: (0, 1),
        x => calc.pow(x, 2),
        x => calc.root(x, 2),
        style: (
          stroke: none,
          fill: tiling(size: (3pt, 3pt), square(stroke: gray)),
        ),
      )
    },
  )
})
2 Likes
Barouk
September 18, 2025, 6:43pm
5
[in french] Comment représenter f(x)=x²-3x+2 ? Et comment tracer les axes de coordonnées x et y, la graduation et les grilles. Je voudrais que vous me donniez un exemple de code avec cette fonction.
Andrew
September 18, 2025, 6:46pm
6
The forum is currently English-only. If you can’t speak, use a translator. If you have a question, create a new Questions
2 Likes