How can I update the figure counter ignoring the figures with `supplement: none`?

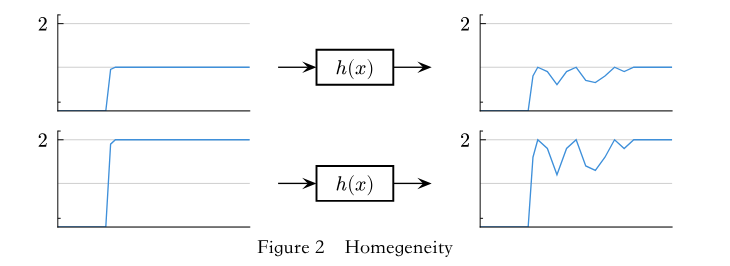
Hi friends, I create two figures using supbar and lilaq package, but I want counter to ignore the first one (I want the caption to be Figure 1 …), what should I do?

The complete code is as follows

#import "@preview/lilaq:0.3.0" as lq
#import "@preview/tiptoe:0.3.0"
#import "@preview/subpar:0.2.2": grid as sgrid

#let (x, y, y2) = lq.load-txt(read("data/homegeneity.csv"))


#let peak(value, distance) = value > 0 and distance < 5pt

#let trans-linear(
  x,
  y,
  y2,
  ylim-base,
  supplement: none,
  caption: none,
  width: 100pt,
  column: 60pt,
  gutter: 50pt,
) = sgrid(
  figure(
    ..if caption == none { (numbering: it => 0) },
    lq.diagram(
      width: width,
      height: width * .5,
      lq.plot(x, y, mark: none),
      xlim: (x.at(0), x.at(-1)),
      ylim: (ylim-base.at(0), ylim-base.at(-1) + ylim-base.at(-1) / 10),
      xaxis: (position: 0, tip: none, ticks: none),
      yaxis: (position: 0, tip: none, filter: peak),
    ),
  ),
  figure(
    ..if caption == none { (numbering: it => 0) },
    lq.diagram(
      width: width,
      height: width * .5,
      lq.place(x.at(-1) * .5, y.at(-1) * .5)[$h(x)$],
      lq.rect(
        x.at(-1) * .3,
        y.at(-1) * .3,
        width: x.at(-1) * .4,
        height: y.at(-1) * .4,
      ),
      lq.line(
        tip: tiptoe.stealth,
        (x.at(-1) * .7, y.at(-1) * .5),
        (x.at(-1) * .9, y.at(-1) * .5),
      ),
      lq.line(
        tip: tiptoe.stealth,
        (x.at(-1) * .1, y.at(-1) * .5),
        (x.at(-1) * .3, y.at(-1) * .5),
      ),
      xlim: (x.at(0), x.at(-1)),
      ylim: (y.at(0), y.at(-1) + y.at(-1) / 10),
      xaxis: (stroke: none, ticks: none),
      yaxis: (stroke: none, ticks: none),
    ),
  ),
  figure(
    lq.diagram(
      width: width,
      height: width * .5,
      lq.plot(x, y2, mark: none),
      xlim: (x.at(0), x.at(-1)),
      ylim: (ylim-base.at(0), ylim-base.at(-1) + ylim-base.at(-1) / 10),
      xaxis: (position: 0, tip: none, ticks: none),
      yaxis: (position: 0, tip: none, filter: peak),
    ),
  ),
  columns: (column,) * 3,
  gutter: gutter,
  kind: "",
  supplement: supplement,
  caption: caption,
)


#trans-linear(
  x,
  y,
  y2,
  lq.vec.multiply(y2, 2),
  supplement: none,
  caption: none,
)
#trans-linear(
  x,
  lq.vec.multiply(y, 2),
  lq.vec.multiply(y2, 2),
  lq.vec.multiply(y2, 2),
  supplement: "Figure",
  caption: "Homegeneity",
)

The data is in csv format

0,0,0
1,0,0
2,0,0
3,0,0
4,0,0
5,0,0
5.5,0.95,0.8
6,1,1
7,1,0.9
8,1,0.6
9,1,0.9
10,1,1
11,1,0.7
12,1,0.65
13,1,0.8
14,1,1
15,1,0.9
16,1,1
17,1,1
18,1,1
19,1,1
20,1,1

You can set the first figure’s numbering to none as unnumbered figures won’t step the counter. To put this in the trans-linear function, you can make this conditional based on whether the caption parameter is none.

figure(
  ..if caption == none { (numbering: none) },
  lq.diagram(..)
)

This may look a bit odd because of the spread operator, but it’s necessary as it allows the default figure numbering to still be used when the caption is not none.


Edit: I kind of missed the subpar part of the question, but it turns out that this answer still works. Ideally, you would set the numbering of the sgrid to none, but that’s not allowed by the package. Also, I’m wondering if the trans-linear function couldn’t just return a single figure containing a grid, since this doesn’t seem to be using any subfigure features like sub-numbering.

2 Likes

See https://sscce.org/.

Your example is big and incomplete, therefore doesn’t compile. The question is about figure numbers, so the figure content should be removed completely. You can use simple text or rect() instead.

1 Like

Thank you, I tried, however, supbar requires the number >=0

Can this be achieved by show rules?

Thanks for advice. I updated the code, it’s complete now. (My first thought was my goal can be achieved by some show rules, which might not be involved with the data or the imported packages).

The current code is based on supar package for a sub-figure layout, supar uses figure objects, so using rect() does not change the things.

It does change the things. The context is providing the smallest possible code samples.

#import "@preview/subpar:0.2.2": grid as sgrid

#let trans-linear(caption: none, column: 60pt) = sgrid(
  columns: (column,) * 3,
  caption: caption,
  figure(rect[left]),
  figure(rect[center]),
  figure(rect[right]),
)

#trans-linear(caption: none)
#trans-linear(caption: "Homegeneity")

image

This is much more manageable and easy to understand.

I didn’t dive deep into this, but since some direct changes are impossible, there is also an explicit counter update:

#import "@preview/subpar:0.2.2": grid as sgrid

#let trans-linear(caption: none, column: 60pt) = {
  sgrid(
    columns: (column,) * 3,
    caption: caption,
    figure(rect[left]),
    figure(rect[center]),
    figure(rect[right]),
  )
  if caption == none { counter(figure.where(kind: image)).update(n => n - 1) }
}

#trans-linear(caption: none)
#trans-linear(caption: "Homegeneity")

image

I just don’t know about the kind. If it’s just the standard image kind, then it’s all should be good, otherwise you might need some additional tweaking.

1 Like

@Andrew, thank you for your investigation, it gives me some helpful hints.

I solved the problem by counting a different kind

#let trans-linear(
  x,
  y,
  y2,
  ylim-base,
  kind: image,
  supplement: "Figure",
  caption: none,
  width: 100pt,
  column: 60pt,
  gutter: 50pt,
) = {
  sgrid(
    lq.diagram(
      width: width,
      height: width * .5,
      lq.plot(x, y, mark: none),
      xlim: (x.at(0), x.at(-1)),
      ylim: (ylim-base.at(0), ylim-base.at(-1) + ylim-base.at(-1) / 10),
      xaxis: (position: 0, tip: none, ticks: none),
      yaxis: (position: 0, tip: none, filter: peak),
    ),
    lq.diagram(
      width: width,
      height: width * .5,
      lq.place(x.at(-1) * .5, y.at(-1) * .5)[$h(x)$],
      lq.rect(
        x.at(-1) * .3,
        y.at(-1) * .3,
        width: x.at(-1) * .4,
        height: y.at(-1) * .4,
      ),
      lq.line(
        tip: tiptoe.stealth,
        (x.at(-1) * .7, y.at(-1) * .5),
        (x.at(-1) * .9, y.at(-1) * .5),
      ),
      lq.line(
        tip: tiptoe.stealth,
        (x.at(-1) * .1, y.at(-1) * .5),
        (x.at(-1) * .3, y.at(-1) * .5),
      ),
      xlim: (x.at(0), x.at(-1)),
      ylim: (y.at(0), y.at(-1) + y.at(-1) / 10),
      xaxis: (stroke: none, ticks: none),
      yaxis: (stroke: none, ticks: none),
    ),
    lq.diagram(
      width: width,
      height: width * .5,
      lq.plot(x, y2, mark: none),
      xlim: (x.at(0), x.at(-1)),
      ylim: (ylim-base.at(0), ylim-base.at(-1) + ylim-base.at(-1) / 10),
      xaxis: (position: 0, tip: none, ticks: none),
      yaxis: (position: 0, tip: none, filter: peak),
    ),
    columns: (column,) * 3,
    gutter: gutter,
    kind: kind,
    supplement: supplement,
    caption: caption,
  )
  if caption == none { counter(figure.where(kind: "skip")).update(n => n - 1) }
}

then calling

#trans-linear(
  x,
  y,
  y2,
  lq.vec.multiply(y2, 2),
  kind: "skip",
)
#trans-linear(
  x,
  lq.vec.multiply(y, 2),
  lq.vec.multiply(y2, 2),
  lq.vec.multiply(y2, 2),
  caption: "Homegeneity",
)
1 Like