Thanks for the quick reply! It’s strange to see it in the manual given that it is an internal-only function and not available for use.
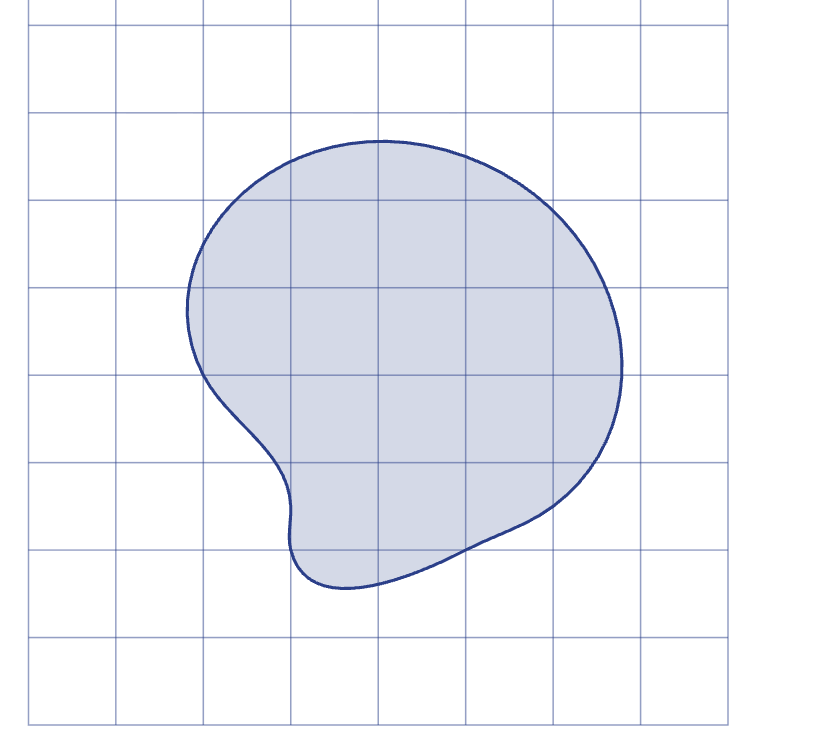
However, I should say the actual goal I had was in calculating the outer bounds of the hobby curve that I had created in order to have a grid that it completely fits inside.
Because a hobby curve can go outside the boundaries of the control points, it’s not just a matter of calculating the minimum and maximum values of the points provided to the hobby function.
For my purposes, I can adapt what you’ve got to make something more like this, which gives the grid (apologies if this isn’t the most elegant way to solve the problem, but it seems to work!)
#cetz.canvas({
  import cetz.draw: *

  group(name: "curve", {
    hobby((0,0), (1,2), (4,3), (2,-2), close: true)
  })

  get-ctx(ctx => {
    let (_, a, b, c, d) = cetz.coordinate.resolve(ctx, "curve.west", "curve.east", "curve.south", "curve.north")
    let xmin = a.at(0)
    let xmax = b.at(0)
    let ymin = c.at(1)
    let ymax = d.at(1)
    grid((xmin, ymin), (xmax, ymax))
  })
})
This is excellent - thanks! I wouldn’t have thought to try that based on the examples of grid that I had seen.
Actually I was oversimplifying in my code snippet as I wanted to have an integer grid (so if xmin was 1.8 then I would take the floor of that to start the grid at x=1, and if xmax was 7.3 I’d take the ceiling to be 8).
But maybe there is also a function that can take an anchor and “floor it” or “ceiling it”!
There is: you can pass any function as coordinate by passing a list of the function and it’s coordinate arguments: (<function>, <coordinate...>). The function the gets called with the resolved arguments.
Wow - this is excellent! I see now that this functionality is documented but I must admit that for a casual user of CetZ it is quite hard to work it all out.
I am hopeful that one day the LLMs can apply it all once there are more examples out in the wild.