First of all, thank you very much @Mc-Zen for the Typst Lilaq package. This will save me hours of work.
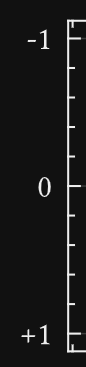
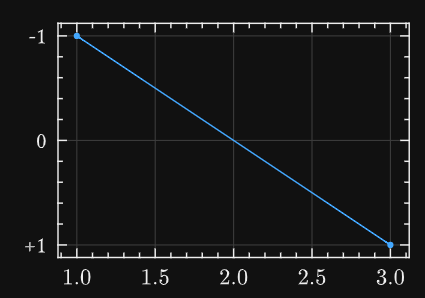
I have been trying to create plots with an axis displaying a plus (+) sign next to the positive label values.
The code below simulates that but it is clear to me that a show rule would be a much simpler approach. This was created to generate the screenshot below, which is what I would like to achieve.
#import "@preview/lilaq:0.1.0" as lq

#let myaxis= ("+1", "0", "-1")

#lq.diagram(
  yaxis: (ticks: myaxis.enumerate(start:1) ),
  // Random values to display - result won't make sense
  lq.plot((1,3),(3,1))
)
After consulting the documentation, I can see that the answer is probably related to one of the following:
#show lq.selector(lq.tick-label): ...

// or

#show: lq.set-tick-label() ...
The Lilaq documentation is great and filled with useful information and examples, but the section on ticks is not completed yet . Any help would be much appreciated. Cheers and thank you in advance.
Hi there!
my solution is rather complicated. Maybe there is a better way to do it, but I’m not aware of it. The problem is that I have to work with the “it” which is of the type content, so I convert it into a string first and after that try to convert it into a number to check if it is greater that 0. So here’s the code:
#import "@preview/lilaq:0.1.0" as lq
#let to-string(content) = {
  if content.has("text") {
    if type(content.text) == str {
      content.text
    } else {
      to-string(content.text)
    }
  } else if content.has("children") {
    content.children.map(to-string).join("")
  } else if content.has("body") {
    to-string(content.body)
  } else if content == [ ] {
    " "
  }
}

#let myaxis= ("1", "0", "-1")
#show lq.selector(lq.tick-label): it => {
  let str_int = to-string(it)
  if (str_int != "" and str_int.matches(regex("^-?\d+(\.\d+)?$")).len() > 0 and float(str_int) > 0) {
    [+]
  }
  it
}

#lq.diagram(
  yaxis: (ticks: myaxis.enumerate(start:1) ),
  // Random values to display - result won't make sense
  lq.plot((1,3),(3,1))
)
If you have any questions left don’t hesitate to ask again
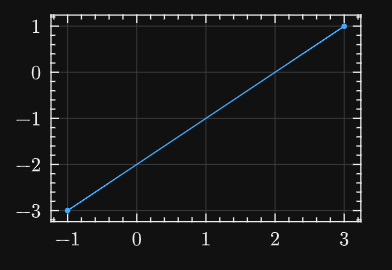
I will look into it. Just to be clear, the following is what I would end up writing:
#import "@preview/lilaq:0.1.0" as lq

#lq.diagram(
  lq.plot((-1,3),(-3,1))
)
We can see that the plus (+) signs are missing on this example. I would not use the quotes to pass custom axes labels to the plot. It was only to be able to generate the screenshot of the desired result.
And I would like the plus (+) showing on the axes (at least one of them) when the label is positive. I will try to implement your solution into my project and let you know. Thank you again for your time.
Oh, dam. Turns out it doesn’t work without the “myaxis”
So using “[#it.children.at(0)]” inside the show rule actually displays all the numbers correctly, but it still has the type content. Oddly enough, “[#it.children.at(0).fields()]” displays an empty dictionary (:)
Because the dictionary is empty, the to-string function I implemented just returns an empty string.
So at this point I don’t really know how to continue. The content has text in it, but I have no idea where to find it…
Yes me too! I was actually surprised your solution worked because I was trying to access the value in the same way in my show rule. As soon as I deleted the line with the hard coded axis values, your solution stopped working
Perhaps the values are left to empty or none when the axis labels are simply calculated from the plot…
Perhaps the values are left to empty or none when the axis labels are simply calculated from the plot…
The thing I don’t understand is that [#it.children.at(0)] still displays the numbers. When I comment the line out, the numbers disappear. So they (in my opinion) have to be in there somewhere
This is actually very easy to achieve through the interaction with zero – Typst Universe, as you already suspected. All numbers in Lilaq are run through a tick formatter and the default tick formatter passes the values through zero.num.
You can manipulate the appearance through settings like:
#zero.set-num(positive-sign: true)
Put this at the start of the document, or at least in front of the lq.diagram(). This should already do the trick.
Would it be possible to apply this setting, for example, only on the xaxis and let the yaxis to default?
Unfortunately not :/ this will be natively possible (even easy) when Typst has built-in user-defined types. But until then, it would be necessary to override the formatter, e.g., through
#lq.diagram(
  yaxis: (format-ticks: ...)
)
but the signature for format-ticks is not finalized which is why it’s not yet documented properly!
Edit: with the future types to come, the solution would look like this:
#show lq.tick.where(kind: "y"): set zero.num(positive-sign: true)
Thanks for the Lilaq update @Mc-Zen, much appreciated.
With version 0.4.0, thanks to the new Ticks Tutorial, I was able to achieve the desired result without maintaining a local version of Lilaq and changing the code to suit my needs.
This works great now:
#import "@preview/lilaq:0.4.0" as lq: *

//Initial solution, but for both axes at the same time
#import "@preview/zero:0.4.0" as zero: *
//#zero.set-num(positive-sign: true)

#let ps-formatter(ticks, ..args) = {
  let result = lq.format-ticks-linear(ticks, ..args)
  ticks
    .zip(result.labels)
    .map(((tick, label)) => {
      if tick > 0 { $+$ } + label
    })
}

#lq.diagram(
  xlabel: [Value],
  ylabel: [Difference],
  yaxis: (format-ticks: ps-formatter),
  lq.plot((-1, 1),(-1, 1),
))
… but it does not make use of Zero. Is it the only way now until Typst offers another solution or is there a more elegant way using Zero?
 . Any help would be much appreciated. Cheers and thank you in advance.