How do I draw a labelled curved arrow next to table entries

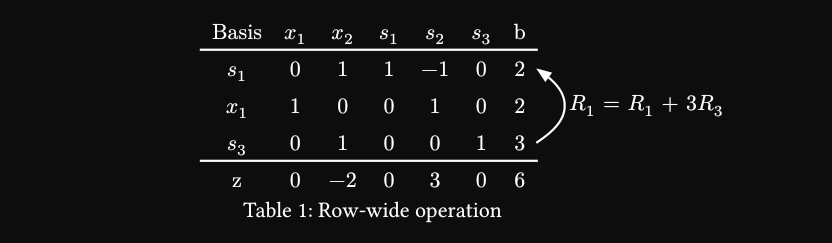
I have the following table:

#align(
    center,
    table(
      // fill: (x, y) =>
      // if x == 5 and y in (0, 4) {
      //   red.lighten(70%)
      // },
      columns: range(7).map(n => auto),
      inset: (x: 0.5em, y: 0.5em),
      align: horizon,
      stroke: none,
      [Basis], [$x_1$], [$x_2$], [$s_1$], [$s_2$], [$s_3$], [$b$],
      table.hline(),
      [$s_1$], [0], [1], [1], [-1], [0], [2],
      [$x_1$], [1], [0], [0], [1], [0], [2],
      [$s_3$], [0], [1], [0], [0], [1], [3],
      table.hline(),
      [$z$], [0], [-2], [0], [3], [0], [6],
    )
  )

I would like to draw a labelled curved arrow to the right of the table to describe row operations. For example, if the row operation is given by $R_1 = R_1 + 3R_3$, then the arrow should start at row 3 and end at row 1.

I only get the essence of what you mean, but a visual example would be better.

#import "@preview/cetz:0.4.0"
#import "@preview/mannot:0.3.0": *

/// Mark something with a tag.
#let tag(body, tag) = mark(body, tag: label(tag))

/// Draw a row operation.
#let rowop(from, to, operation) = {
  annot-cetz((from, to).map(label), cetz, {
    import cetz.draw: *
    set-style(mark: (end: ">", fill: black))
    let offset = 0.3
    let a = (rel: (offset, 0), to: from)
    let b = (rel: (offset, 0), to: to)
    let mid = (rel: (0.5, 0), to: (a, 50%, b))
    hobby(a, mid, b)
    content(mid, anchor: "west", pad(0.2em, operation))
  })
}

#let table = table // Include table in math scope.

#figure(
  $table(
    columns: #7,
    inset: #0.5em,
    // align: #horizon,
    stroke: #none,
    "Basis", x_1, x_2, s_1, s_2, s_3, b,
    table.hline(),
    s_1, 0, 1, 1, -1, 0, tag(2, "1"),
    x_1, 1, 0, 0, 1, 0, 2,
    s_3, 0, 1, 0, 0, 1, tag(3, "3"),
    table.hline(),
    z, 0, -2, 0, 3, 0, 6,
  )
  rowop("3", "1", R_1 = R_1 + 3R_3)$,
  caption: [Row-wide operation],
)

3 Likes