How do I make universal settings for my graphs?

This is what I’m using right now, but I would really like to start using templates to change all my figures and documents at once, to achieve real consistency in my documents.
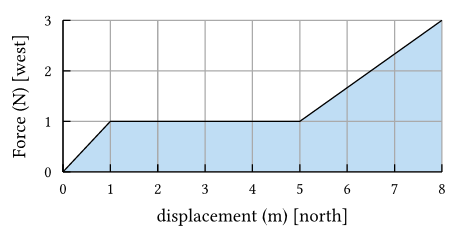
Screenshot 2025-03-15 at 1.50.09 PM

Is made by

#import "@preview/cetz:0.3.2": canvas, draw, draw.set-style, draw.stroke, palette
#import "@preview/cetz-plot:0.1.1": plot, chart

  #canvas({

  // Your plot/chart code goes here
  import draw: *
  set-style(axes: (
    stroke: 0.5pt, 
    tick: (
      stroke:0.5pt,
    ),
    grid: (
      stroke: gray + 0.5pt,
      dashed: "dotted",
    )
  )
)
  plot.plot(size: (5,2), x-tick-step: 2,
  y-tick-step: 5,
  x-format: v => text(6pt,str(v)),
  y-format: v => text(6pt,str(v)),
  x-label: text(7pt, [displacement (m) [west]]),
  y-label: text(7pt, [Force (N) [west]]),
  x-grid: "both",
  y-max: 25,
  x-max: 14,
  y-grid:"both",
  title: "Filled",
  grid-style: (stroke: blue),
  axis-style: "scientific-auto",
  {
    plot.add-fill-between(
      ((0,10),(2,20), (12,20)),
      ((0,0),(12,0),), style: (stroke: none))
    plot.add(((0,10),(2,20),(12,20)), style: (stroke: black, ))
  }
)

})

but I have to copy and paste this code and then I have to change all of them individually if I want something to be different.

Any tips on making these settings part of a template would be appreciated and I would also appreciate any aesthetic criticisms and ideas to help make my graphs look nicer.

Thanks!

1 Like

Hi, this is super easy.

Could you tell me which settings should be identical to all graphs, and which you would like to set individually per graph? Maybe x-max for example?

Then I could create a simple example code for you.

1 Like

These ones would be great. Thank you for your offer!

Hi William,

I looked into your request and developed a solution that combines two different approaches. The goal is to define global settings for plots in a centralized way and have a function that automatically applies these settings to every graph.

First Approach: Global Settings
I created a plot-settings variable that stores various parameters like x-grid or axis-style. This allows you to define these values in one place and reuse them in every plot.

#let plot-settings = (
  x-format: v => text(6pt,str(v)),
  y-format: v => text(6pt,str(v)),
  x-grid: "both",
  axis-style: "scientific-auto",
)

Second Approach: A Wrapper Function
Additionally, I implemented a william-graph function that automatically applies axis styling. This way, you don’t have to manually define styling each time.

#let william-graph(body) = canvas({
  import draw: *
  set-style(axes: (
      stroke: 0.5pt, 
      tick: (
        stroke:0.5pt,
      ),
      grid: (
        stroke: gray + 0.5pt,
        dashed: "dotted",
      )
    )
  )
  body
})

Example Usage
Here, the function is used to create a plot with global settings and predefined axis styling:

#william-graph({
  plot.plot(size: (5,2), x-tick-step: 2,
  y-tick-step: 5,
  x-label: text(7pt, [displacement (m) [west]]),
  y-label: text(7pt, [Force (N) [west]]),
  y-max: 25,
  x-max: 14,
  y-grid:"both",
  title: "Filled",
  ..plot-settings,
  grid-style: (stroke: blue),
  {
    plot.add-fill-between(
      ((0,10),(2,20), (12,20)),
      ((0,0),(12,0),), style: (stroke: none))
    plot.add(((0,10),(2,20),(12,20)), style: (stroke: black, ))
  }
)
})

This setup allows you to manage your plots more easily and maintain consistent styling. You can find a working example here: Example Project. Let me know if you need further adjustments!

3 Likes