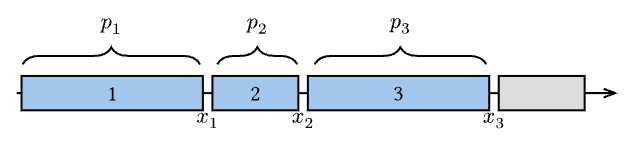
I want to offset the x-tick labels (x_1, x_2 and x_3) only by a y value (make them lower) on the plot.
#align(center)[
  #cetz.canvas({
    import cetz.draw: *
    import cetz-plot: *

    set-style(
      axes: (
        y: (stroke: 0pt),
        // x: (stroke: 0pt),
        tick: (stroke: 0pt),
        padding: 0pt,
      ),

    )

    plot.plot(
      size: (10,2),
      axis-style: "school-book",
      x-tick-step: none,
      y-tick-step: none,
      x-ticks: range(10).map(n => (n+1, [])),
      x-label: [],
      y-label: none,
      x-min: 1, x-max: 7,
      y-min: -1, y-max: 1,

      axes: (
        stroke: black,
        tick: (stroke: 0pt),
      ),
      name: "plot",
    {
      plot.add(((0,0), (3,0)), style: (stroke: none))

      plot.annotate({
        rect(
          (1.05,-0.3),
          (2.95, 0.3),
          fill: blue.lighten(60%),
          // radius: 1pt
        )
        content((2, 0), [3])
      })

      plot.annotate({
        rect(
          (3.05,-0.3),
          (3.95, 0.3),
          fill: blue.lighten(60%),
          // radius: 1pt
        )
        content((3.5, 0), [1])
      })

      plot.annotate({
        rect(
          (4.05,-0.3),
          (5.95, 0.3),
          fill: blue.lighten(60%),
          // radius: 1pt
        )
        content((5, 0), [2])
      })

      plot.annotate({
        rect(
          (6.05,-0.3),
          (6.95, 0.3),
          fill: gray.lighten(60%),
          // radius: 1pt
        )
      })

    }
  )
  })
]
More generally, where do I find all the set-style options that are available to me?