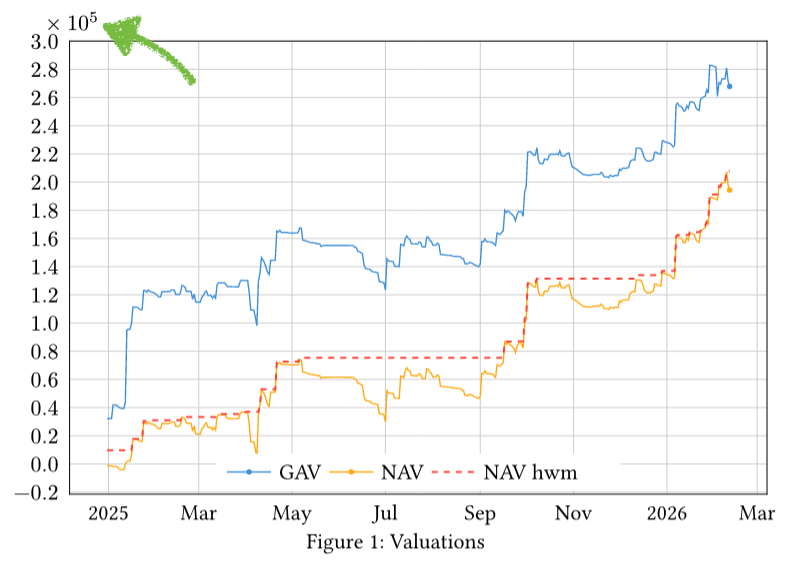
In this project on line 93 you will see the chart below, which has x 10⁵ on the y axis. How would I remove this and make the numbers explicit? (For example, instead of 2.8, we get 280000.)
Tried looking at the axis formatting docs, and I see there are exponent and auto-exponent-threshold but they either don’t seem to work when put into the lq.diagram arguments, and anyway I’m not even sure this is the way to go. Unless I have to write a custom formatter or something?
Also how would I make any solution global to all y-axes in the document?