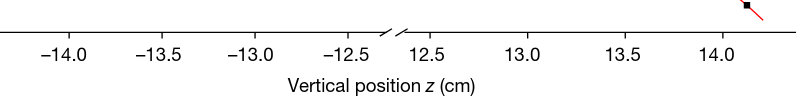
I am trying to make a Figure with a “discontinuous” axis. Something like the following example (but vertical instead of horizontal):
I guess this is too niche, and there is no built-in way to do this, right?
So I am trying to do it with 2 diagrams on top of each other, but I am having some issues with a couple of things.
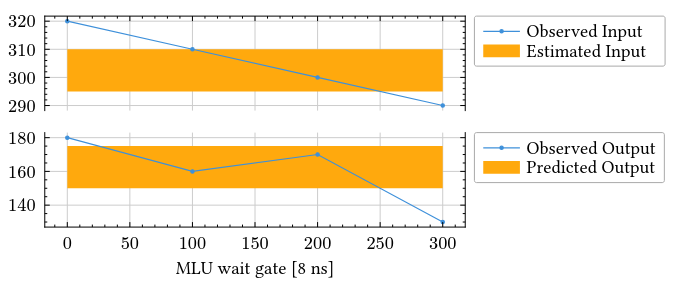
I can get something that starts looking in the correct direction:
#import "@preview/lilaq:0.4.0" as lq

#lq.diagram(
  width: 8.9cm,
  height: 2cm,
  legend: (position: (100% + .5em, 0%)),
  xaxis: (position: top, format-ticks: none),
  lq.plot(
    (0, 100, 200, 300),
    (320, 310, 300, 290),
    label: [Observed Input~~~],
  ),
  lq.fill-between(
    (0, 300),
    (310, 310),
    y2: (295, 295),
    label: [Estimated Input],
    z-index: 1,
  ),
)

#lq.diagram(
  width: 8.9cm,
  height: 2cm,
  xaxis: (position: bottom),
  xlabel: [MLU wait gate [8 ns]],
  legend: (position: (100% + .5em, 0%)),
  lq.plot(
    (0, 100, 200, 300),
    (180, 160, 170, 130),
    label: [Observed Output],
  ),
  lq.fill-between(
    (0, 300),
    (175, 175),
    y2: (150, 150),
    label: [Predicted Output],
    z-index: 1,
  ),
)
which gives me
Issues I am having:
- I don’t know how to add these
/ /(or similar) between the gaps at the edges of the axis to give the idea of “discontinuous”. - I don’t know how to add a
ylabelthat is shared between both. If I try adding e.g.ylabel: [Counter rate [Hz]]to either of them, I can’t get it to not wrap around (and it shifts the individual diagram to the side, so they are not aligned any more).