I would like to typeset a block diagonal matrix similarly to how it is done in this Math Stack Exchange answer, I have tried nesting mat inside other mat but it doesn’t look too good
3 Likes
Far away from being a final solution, but using tables could be a workaround if matrix colspan/rowspan is not available.
$(
  #table(
    columns: (auto,) * 4,
    stroke: none,
    align: (center + horizon,) * 4,
    $40$, $0$, $0$, $0$,
    $0$, $80$, $100$, $0$,
    $0$, $40$, $120$, $0$,
    $0$, $0$, $0$, $60$,
  )
)^(-1) =
(
  #table(
    columns: (auto,) * 4,
    stroke: none,
    align: (center + horizon,) * 4,
    $(40)^(-1)$, $0$, $0$, $0$,
    $0$, table.cell(colspan: 2, rowspan: 2)[$mat(80, 100; 40, 120)^(-1)$], $0$,
    $0$, $0$,
    $0$, $0$, $0$, $(60)^(-1)$,
  )
)$
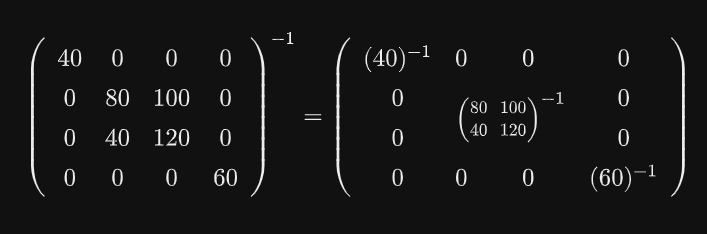
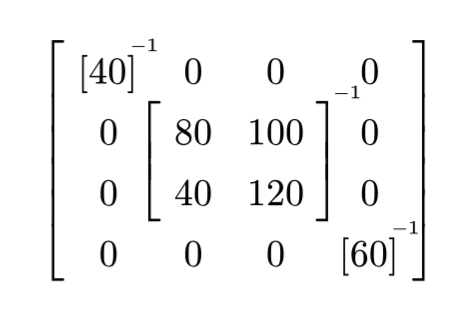
Note that [ and ] could have been used, and another inner table for the 2x2 matrix. There is some work to do to finalize proper padding / gap.
1 Like
Thank you, having the numbers of different sizes looks a bit off, I will try to play a bit with the paddings
Here is another increment, which I’d love to finish but can’t right now.
-
I’d like to use one mat, grid or table for all levels so that element alignment is correct
- maybe keeping in mind that equation alignment markers is a fourth way that we haven’t explored
-
either we have to use rowspan in tables or we need to place brackets outside of the grid of cells. I’ve tried to do the latter.
This kind of works, but needs more work on the placement and sizes. I use smashop so that supscripts don’t disturb element alignment, but supscripts are clearly misplaced right now
// By Eric on forum
// but modified/(hackjob) for placement
#let smashop(body, side: center) = math.display(
  move(dy: -0.4em, dx: 0.2em,
  box(baseline: 0em, height: 0pt, width: 0pt, align(
    side.inv(),
    box(baseline: 0em, height: 1em, width: float.inf * 1pt, $ sscript(body) $))
  ))
)

// place big bracket (left), spanning n rows. Assuming constant row height.
#let brl(n, elt: none, inset: 5pt, delim: [\[], align: top + left, dx: -1em, sup: []) = context {
  let elt = elt
  if elt == none { elt = $ 1 $}
  let h = n * measure(math.display(elt)).height + (2*n)*inset
  place(align, dx: dx)[$lr(#delim, size: #h)^#sup$]
}

#let brr = brl.with(delim: [\]], align: top + right, dx: 1em)

  #table(
    columns: 4,
    stroke: none,
    align: (center + horizon),
    {brl(4); $[40]^smashop(-1)$ }, $0$, $0$, {$0$; brr(4)},
    $0$, {brl(2);$80$}, {$100$; brr(2, sup: $smashop(-1)$)}, $0$,
    $0$, $40$, $120$, $0$,
    $0$, $0$, $0$, $[60]^smashop(-1)$,
  )
The goal of the exercise is to find a good way to layout it, then after that find a nice way to express it as reusable functions.
4 Likes
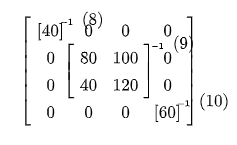
Thank you, but this unfortunately results in some weird behavior when math numbering is enabled. I would prefer achieving the correct look in normal math mode, I personally don’t like too much the table approach, but this is the best I could come up with:
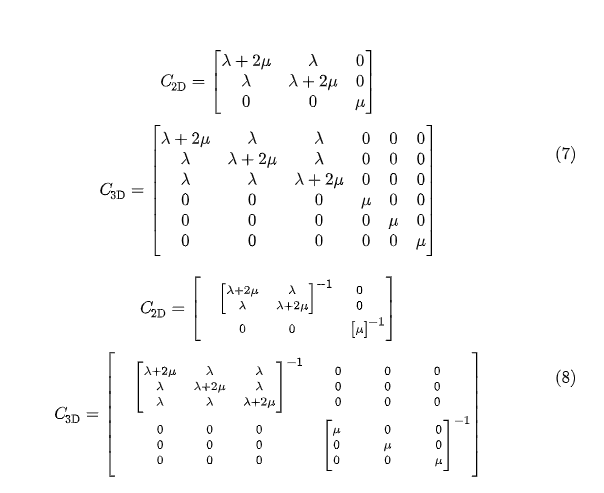
But it’s still not really ideal due to the spacing being a bit uneven and the font size being a bit small (which I’m not really sure how to change inside the matrix). The code is the following
#set math.mat(column-gap: 1em, delim: "[")
#set math.equation(numbering: "(1)")
$
C_"2D" = mat(
lambda + 2 mu, lambda, 0;
lambda, lambda + 2 mu, 0;
0, 0, mu
)\ C_"3D" = mat(
lambda + 2 mu, lambda, lambda, 0, 0, 0;
lambda, lambda + 2 mu, lambda, 0, 0, 0;
lambda, lambda, lambda + 2 mu, 0, 0, 0;
0, 0, 0, mu, 0, 0;
0, 0, 0, 0, mu, 0;
0, 0, 0, 0, 0, mu
)
$
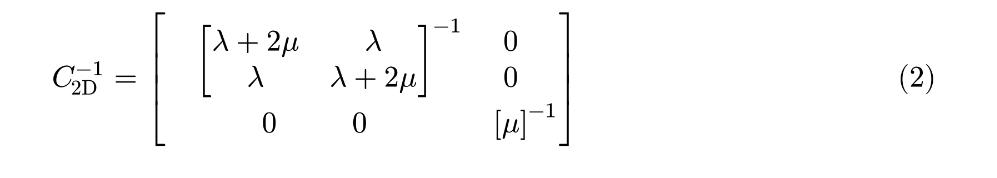
$
C_"2D"^(-1) = mat(
column-gap: #0em,
space space space mat(
lambda + 2 mu, lambda;
lambda, lambda + 2 mu
)^(-1),
mat(delim: #none, 0; 0);
mat(delim: #none, column-gap: #2.5em, 0, 0), space space space mat(mu)^(-1)
)\ C_"3D"^(-1) = mat(
column-gap: #0em,
space space space mat(
lambda + 2 mu, lambda, lambda;
lambda, lambda + 2 mu, lambda;
lambda, lambda, lambda + 2 mu
)^(-1),
mat(column-gap: #2.5em, delim: #none, 0, 0, 0; 0, 0, 0; 0, 0, 0);
mat(column-gap: #2.5em, delim: #none, 0, 0, 0; 0, 0, 0; 0, 0, 0),
space space space mat(column-gap: #2.5em, mu, 0, 0; 0, mu, 0; 0, 0, mu)^(-1)
)
$
1 Like
The spacing issue is probably non-trivial to fix but to fix the font size you can pass the matrix entries to math.display:
#let dmat(..args) = {
  if type(args.pos().first()) != array {
    return math.mat(
      ..args.named(),
      ..args.pos().map(math.display)
    )
  }
  return math.mat(
    ..args.named(),
    ..args.pos().map(i => i.map(math.display))
  )
}

$
  C_"2D"^(-1) = dmat(  // math.display sized matrix
    column-gap: #0em,
    space space space mat(
      lambda + 2 mu, lambda;
      lambda, lambda + 2 mu
    )^(-1),
    mat(delim: #none, 0; 0);
    mat(delim: #none, column-gap: #2.5em, 0, 0), space space space mat(mu)^(-1)
  )
$
2 Likes
Oh, that’s a nice trick. With the spacing set to 3.5em and the column gap to #(-0.5em) for the matrices under the lambdas it looks basically perfect now. Thank you!
2 Likes
Regarding this solution, I’ll note that grid should probably be used here instead of table. The latter has semantic purposes and makes a difference for accessibility.
2 Likes
How can we understand the details of this better? I guess the line between what should be a grid or table is fuzzy? Here we produce a matrix which is a tabular coherent arrangement of user visible data. It sounds closer to table than to a grid, for just layout, to me.
In terms of layout, i.e. the visual outcome, both grid and table are identical. You use grid when layout is all you need. You use table when it is an actual semantic table, which would go in a figure(kind: table), can have a table header, etc. This isn’t the case here - a mat isn’t a table, so simulating it shouldn’t be one either.
This is the part I’m wondering about. What defines a semantic table?
It’s a good question. Perhaps this is a good way to sum it up:
A table can be classified as a data table whenever you need to specify a row or column with header information about that row/column. If no informational header is needed, then it is a formatting table.
– Accessibility at Penn State | Tables
As well as
Data tables are used to organize data with a logical relationship in grids. Accessible tables need HTML markup that indicates header cells and data cells and defines their relationship. Assistive technologies use this information to provide context to users.
– Tables Tutorial | Web Accessibility Initiative (WAI) | W3C
So it defines a logical relationship between rows and columns, which you usually use a header to describe. A mathematical matrix may have a mathematical relationship between cells and their positions, but not a logical one (unless it is indeed a table). What we are doing here would be called a “presentation table” in HTML, or simply using grid layout without any additional meaning. A table header wouldn’t make sense here, a matrix simply holds numbers.
To clarify, the data in the matrix could come from a source where there is a logical relationship. Then it would be able to be displayed as a table too. But while it is a matrix, it is in principle a purely mathematical relationship, and a screen reader should just read the numbers out loud, much like we ourselves would.
1 Like