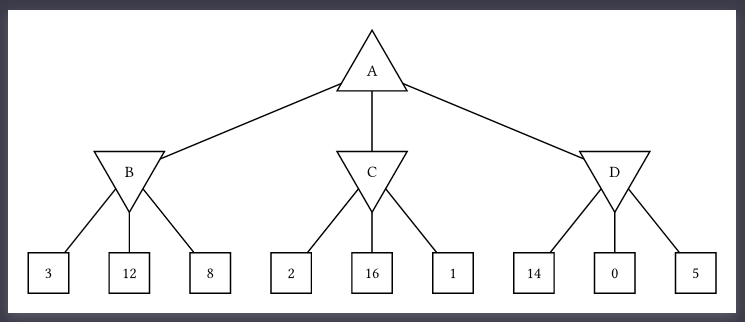
I’ve been trying to create a diagram similar to this diagram with different data filled (all rectangles / triangles filled):

possibly with on/off setting for alpha/beta
Here’s my attempt:
#import "@preview/cetz:0.4.2" as cetz: canvas,

#canvas({
  import cetz.tree
  import cetz.draw: *
  set-style(content: (padding: .1))
  tree.tree(
    (([A]), ([B], [3], [12], [8]), ([C], [2], [16], [1]), ([D], [14], [0], [5])),
    draw-node: (node, ..) => {
      if node.depth == 0 {
        polygon((), 3, angle: 90deg)
        content((),node.content)
      } else if node.depth == 1 {
        polygon((), 3, angle: -90deg)
        content((),node.content)
      } else if node.depth == 2 {
        content(
          (-0.5, -0.5),
          (0.5, 0.5),
          box(
             node.content,
             stroke: 1pt,
             width: 100%,
             height: 100%,
             inset: 1em
             )
          )
      }
    }
  )
})
Here’s the output:
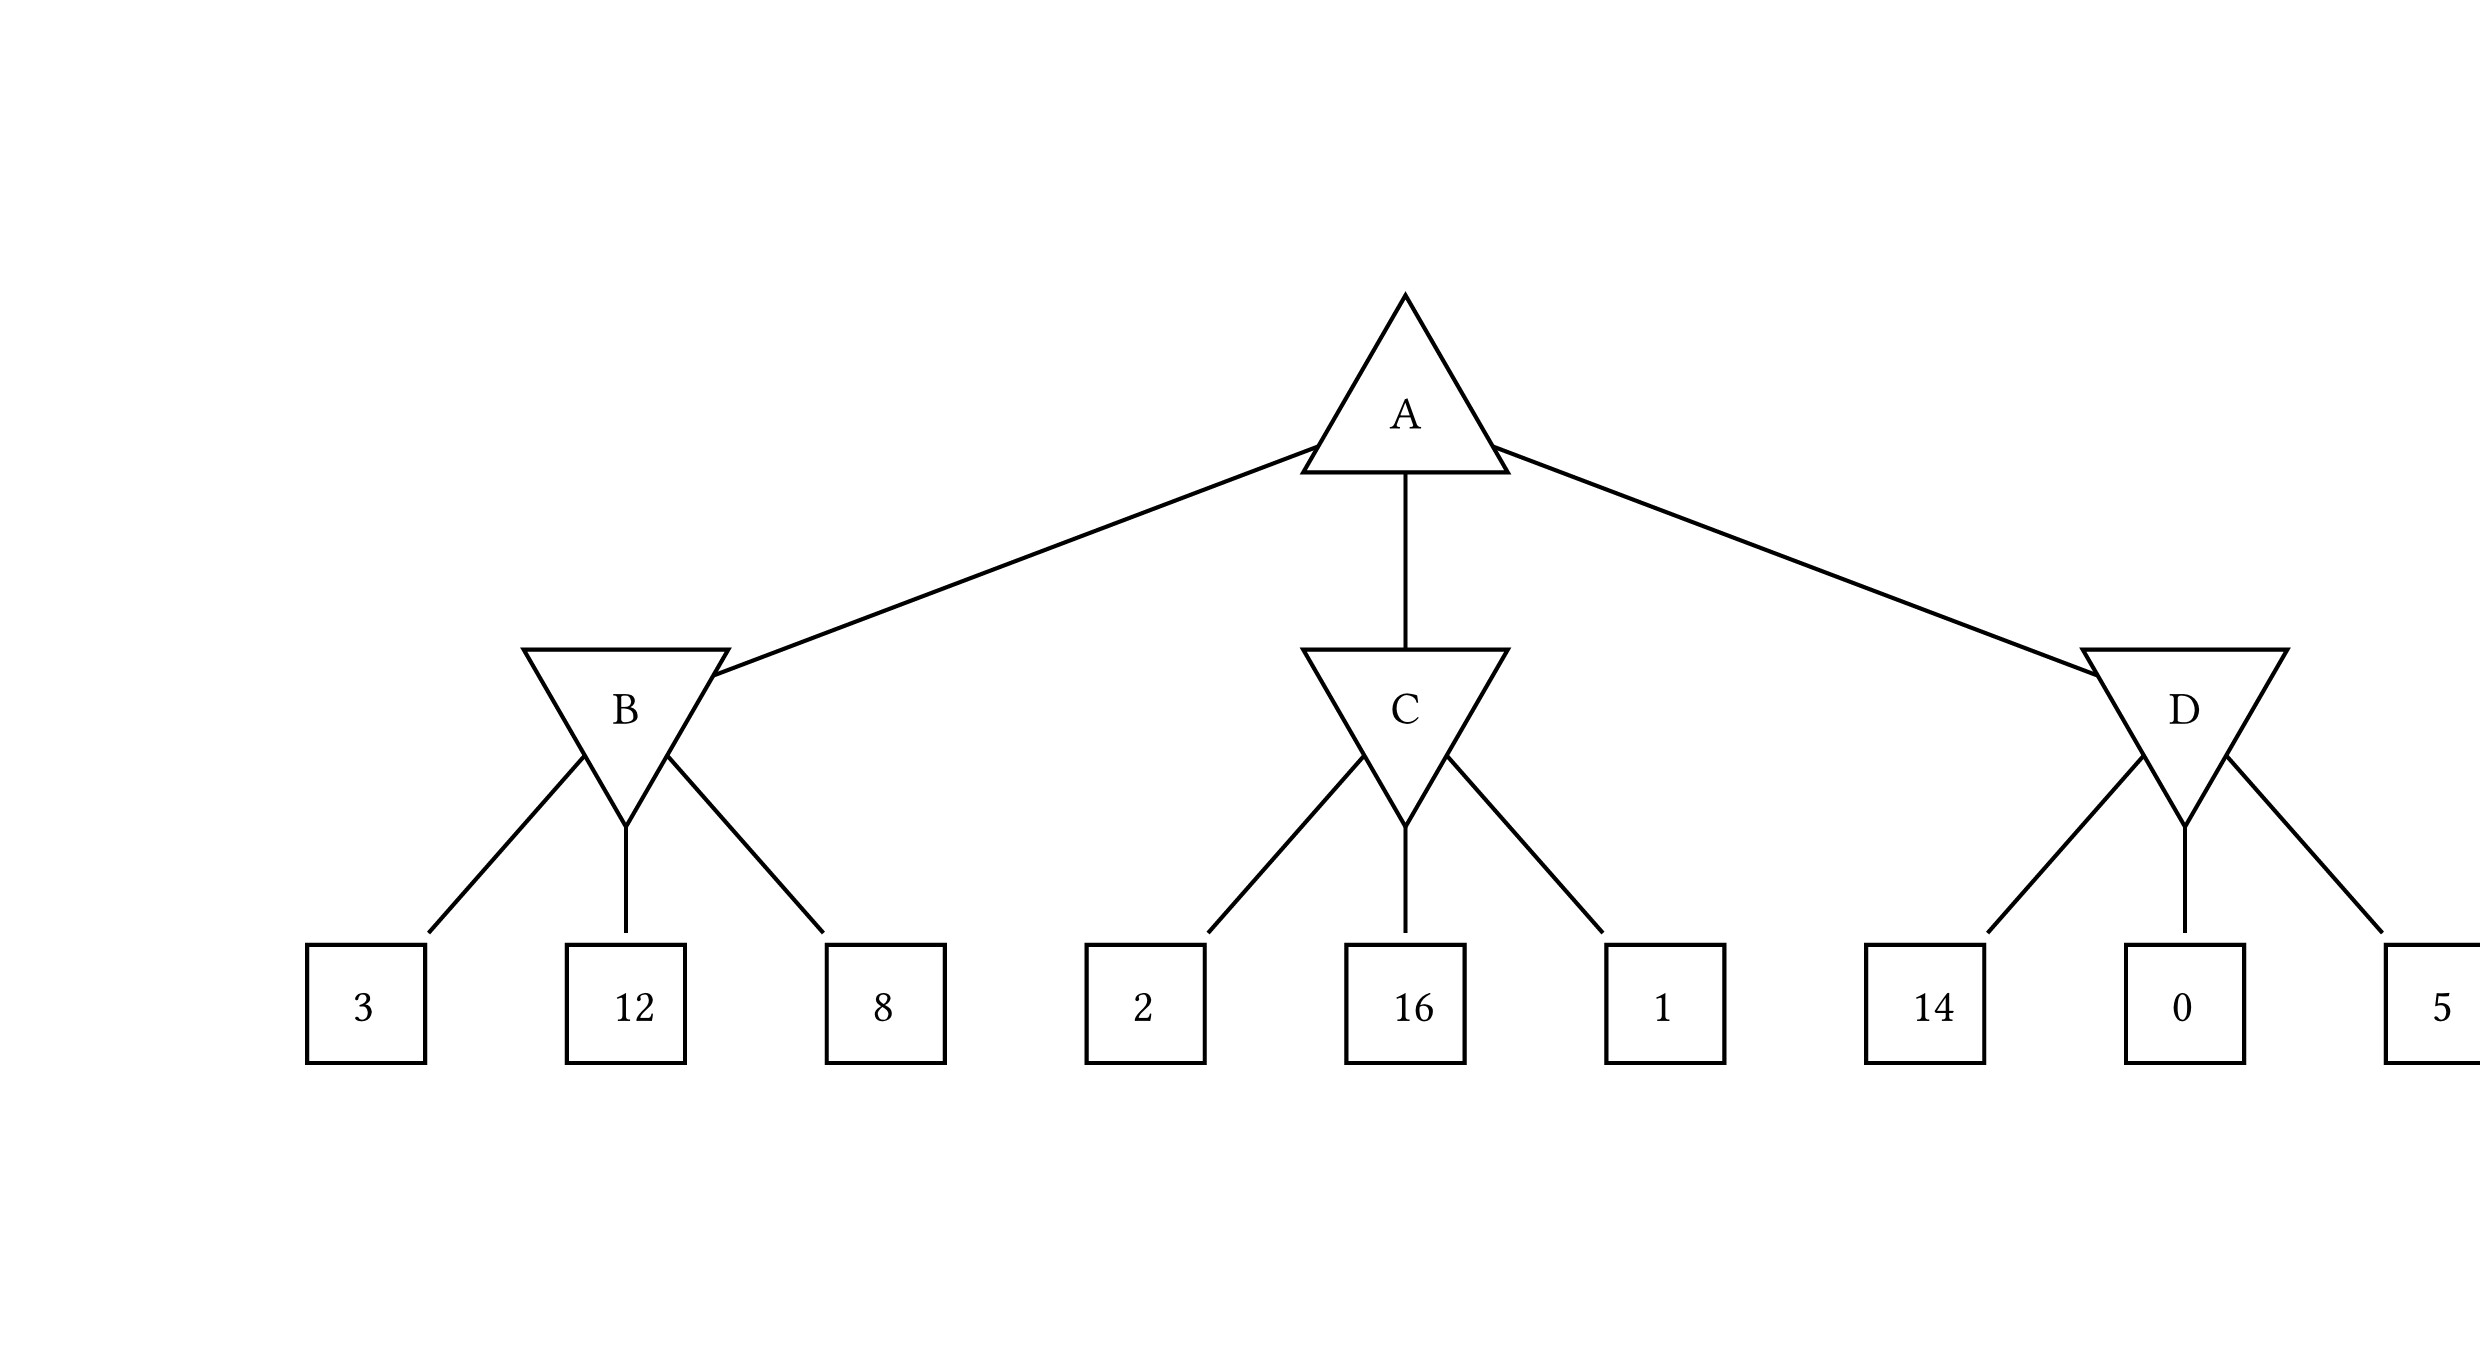
I can see that the numbers are not aligned correctly and the lines are not to the center of the box