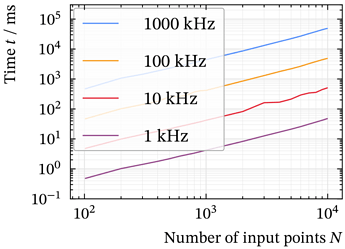
When generating plots using the package lilaq, is it possible to adjust the spacing between the legend elements, so it takes up less space?
Hi there @michi_h, it is a bit tricky to help you without seeing the original code (the spacing in your legend seems huge, perhaps because of a show rule somewhere?) but I suspect the following will set you on the right track.
#show lq.selector(lq.legend): set grid(inset: 1pt)
//#show lq.selector(lq.legend): set grid(inset: 12pt)

#lq.diagram(
  lq.plot((1,2,3), (1,2,3), label: [A]),
  lq.plot((1,2,3), (2,3,4), label: [B]),
)
If not, another set grid with another parameter should do. Please let us know how it works for you and feel free to share that bit of code you are using so we can see better if it doesn’t work.
This from Legend customization − Lilaq.
Note: Since version 4:
The legend now uses a
gridinstead of atableto lay out its items, so you need to replace anyshow lq.selector(lq.legend): set table(..)withshow lq.selector(lq.legend): set grid(..)
thanks for the help, this gave me a good hint. I’m using lilaq inside a subpar.grid, which apparently modifies grid gutter. To fix this, I added this show rule:
#show lq.selector(lq.legend): set grid(gutter: 1pt)
