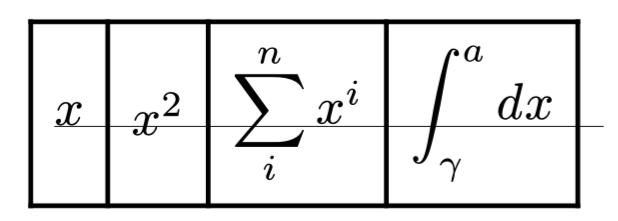
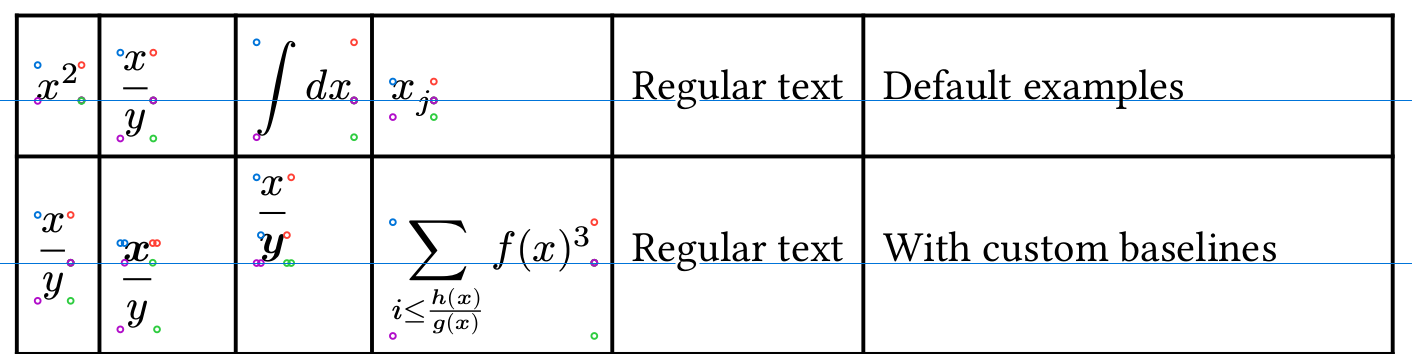
How do I align these display equations in a table so that they line up naturally. I’ve drawn an underline under the first x since I think it draws the line I want it the equations to align to - every x in every equation should stand on the same line.
Maybe something like this? It’s a bit naive, and probably not very robust. It seems to be fairly good.
I am not sure how to measure the difference between the stretched attached base and the attachment though. I added the variable height - .3em, which seems to align.
#show grid.cell: it => context {
  it
  if it.body.has("body") {
    if it.body.body.has("children") {
      let var = it
        .body
        .body
        .children
        .filter(x => (if x.has("base") { x.base.text } not in ("∑", "∫")))
        .filter(x => x != [ ])
      v(measure(var.first()).height - .3em)
    } else {
      v(measure(it.body).height)
    }
  }
}
#grid(
  columns: 6,
  stroke: 1pt + black,
  inset: 5pt,
  align: horizon,
  $ markul(x, outset: #(bottom: 0.2pt, right: 3em * 6), stroke: #0.2pt) $,
  $ x $,
  $ x^2 $,
  $ sum_i^n x^i $,
  $ integral_gamma^a d x $,
  $ sum_a_a_a integral_sum z_x$
)
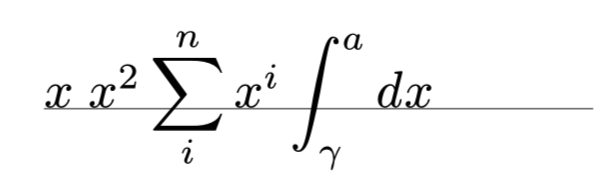
But this doesn’t help for grids/tables, they don’t align on baselines.
I think your approach is eventually going to be a lot better - measuring each part by itself. But maybe each part needs to be inserted into a block equation to be able to measure it correctly?
I’ve also experimented with a simpler approach: insert a vertically high enough item like a stretched $integral$ or $arrow.t$, and hide it. It does about as well as your solution.
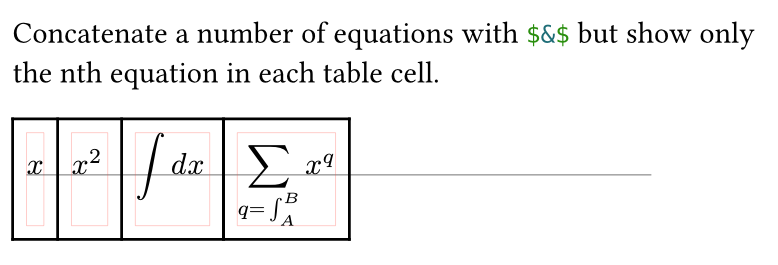
So there is a “perfect” solution, in the sense of perfectly aligned based on the idea of if you can’t beat them join them. So join the equations with an alignment point $&$ into one big equation, but in each table cell, hide the other parts of the equation… The code is in the same project Typst in a different file (concat and hide.typ).
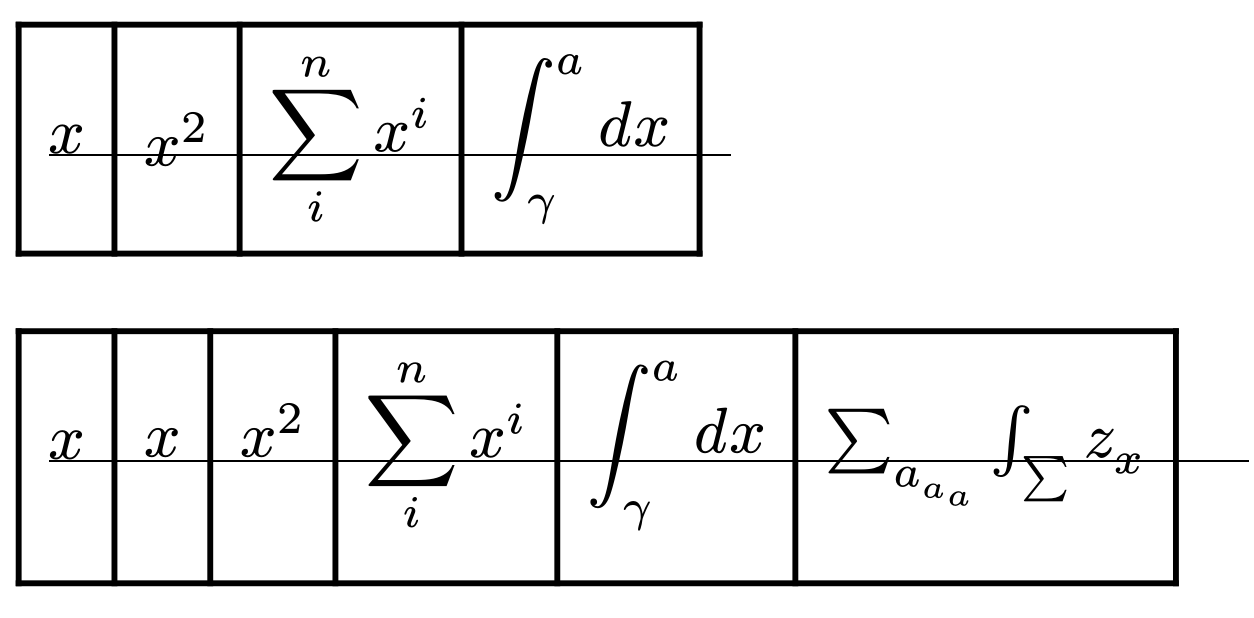
#import "@preview/mannot:0.3.0": markul

#{
  [ Concatenate a number of equations with ```typst $&$``` but show only\ the nth equation in each table cell. ]
  // Concatenate a number of equations with &, but show only the nth
  let concat-and-hide(..args, nth: none) = {
    math.equation(args.pos().enumerate().map(((i, elt)) => context {
      let sz = measure(elt)
      if i == nth {
        elt
      } else {
        std.hide(elt) + h(-sz.width)
      }
    }).join($&$), block: true)
  }

  let equationrow(..args) = {
    let eqs = args.pos()
    for (index, eq) in eqs.enumerate() {
      (concat-and-hide(..eqs, nth: index), )
    }
    ()
  }

  show table.cell: it => {
    show math.equation.where(block: true): set align(it.align) if it.align != auto
    it
  }
  show math.equation: block.with(stroke: 0.1pt + red)

  let markul = markul.with(outset: (bottom: 0.2pt, right: 20em), stroke: 0.2pt)
  table(
    columns: 4,
    ..equationrow(
      $ markul(x) $,
      $ x^2 $,
      $ integral d x $,
      $ sum_(q=integral_A^B) x^q $,
    )
  )
}
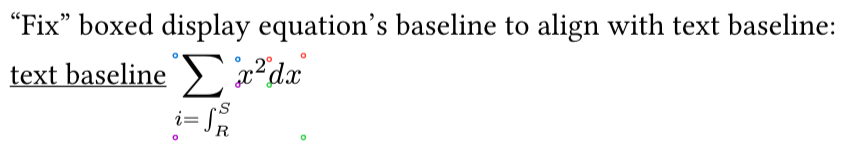
That is a clever idea! I think in any case, this would be a non-issue if we could control the horizontal baseline of a block equation in align(horizon).
Currently, I think the horizon alignment always has a weird behaviour when stretching the base and aligning the other attachments.
(The custom baseline refer to that the numerator and denominator are marked as being on the baseline respectively.)
The major challenge is to avoid the layout convergence warning - any solution trying to insert vertical space seems to fall to that problem, but this method, using box(baseline: ...) with a computed baseline adjustment, seems to work.
I wrote up some current open questions - would be great to know what can be done about them. But it is as of now a reusable implementation.
Areas we would like to improve or mysteries we would like to have answers to:
We place a hidden copy of the equation just to measure it. How to avoid doing this?
The dy parameter of the placed hidden copy actually matters for layout convergence, which is puzzling. Keeping dy very large solves this problem. Why does this happen?
A fixed bias value in em needs to be passed - can this be avoided?
Set value based on maximum height in the row did not converge (using state).
Using horizon alignment avoids it
Currently works with all alignments Get horizon alignment to work.
top alignment: positive bias
bottom alignment: negative bias
horizon alignment: zero bias
Changes
22 June: first post
23 June: Simplified how baseline is measured, which solves convergence problems for horizon alignment.