Hi everyone,
I’m fairly new to using the cetz package and was wondering if there’s a built-in or recommended way to create a radar chart with it, rather than building one entirely from scratch.
Thanks in advance for your help!
Hi everyone,
I’m fairly new to using the cetz package and was wondering if there’s a built-in or recommended way to create a radar chart with it, rather than building one entirely from scratch.
Thanks in advance for your help!
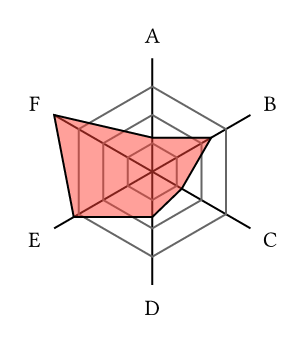
There is no built-in radar chart in CeTZ no. Here is a quick example of how you could make one though. This could be a great addition to cetz-plot I think
#import "@preview/cetz:0.4.1": canvas, draw

#canvas({
  let radar(
    pos,
    data,
    radius: 1,
    ticks: (0.25, 0.5, 0.75),
    label-key: 0,
    value-key: 1,
    web-style: (
      stroke: black.lighten(40%)
    ),
    ..style
) = {
    let angle = 360deg / data.len()
    let pts = ()
    for (i, d) in data.enumerate() {
      let label = d.at(label-key)
      let value = d.at(value-key)
      let axis-name = "axis-" + str(i)
      draw.line(
        pos,
        (
          rel: (-angle * i + 90deg, radius),
          to: ()
        ),
        name: axis-name
      )
      draw.content(
        (axis-name + ".start", radius * 1.2, axis-name + ".end"),
        label
      )
      pts.push((axis-name + ".start", radius * value, axis-name + ".end"))
    }
    for tick in ticks {
      let pts2 = ()
      for i in range(data.len()) {
        pts2.push((
          rel: (-angle * i + 90deg, radius * tick),
          to: pos
        ))
      }
      draw.line(..pts2, close: true, ..web-style)
    }
    draw.line(..pts, close: true, ..style)
  }

  radar(
    (0, 0),
    (
      ([A], 0.3),
      ([B], 0.6),
      ([C], 0.3),
      ([D], 0.4),
      ([E], 0.8),
      ([F], 1)
    ),
    fill: red.transparentize(50%),
    radius: 2,
  )
})