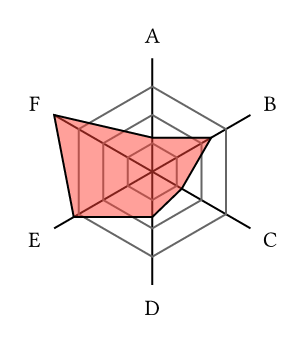
There is no built-in radar chart in CeTZ no. Here is a quick example of how you could make one though. This could be a great addition to cetz-plot I think
Code
#import "@preview/cetz:0.4.1": canvas, draw

#canvas({
  let radar(
    pos,
    data,
    radius: 1,
    ticks: (0.25, 0.5, 0.75),
    label-key: 0,
    value-key: 1,
    web-style: (
      stroke: black.lighten(40%)
    ),
    ..style
) = {
    let angle = 360deg / data.len()
    let pts = ()
    for (i, d) in data.enumerate() {
      let label = d.at(label-key)
      let value = d.at(value-key)
      let axis-name = "axis-" + str(i)
      draw.line(
        pos,
        (
          rel: (-angle * i + 90deg, radius),
          to: ()
        ),
        name: axis-name
      )
      draw.content(
        (axis-name + ".start", radius * 1.2, axis-name + ".end"),
        label
      )
      pts.push((axis-name + ".start", radius * value, axis-name + ".end"))
    }
    for tick in ticks {
      let pts2 = ()
      for i in range(data.len()) {
        pts2.push((
          rel: (-angle * i + 90deg, radius * tick),
          to: pos
        ))
      }
      draw.line(..pts2, close: true, ..web-style)
    }
    draw.line(..pts, close: true, ..style)
  }

  radar(
    (0, 0),
    (
      ([A], 0.3),
      ([B], 0.6),
      ([C], 0.3),
      ([D], 0.4),
      ([E], 0.8),
      ([F], 1)
    ),
    fill: red.transparentize(50%),
    radius: 2,
  )
})