How to create loop on a single point in fletcher diagram?

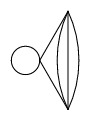
I am trying to recreate the following Feynman diagram

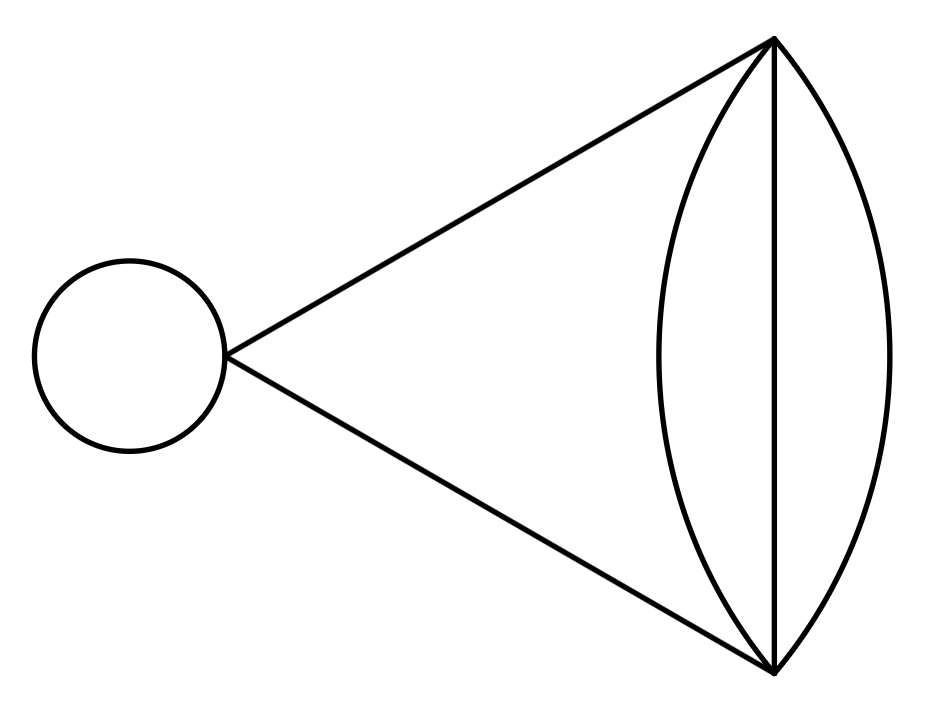
but I cannot get the loop on the one vertex to work. I have

#set page(
  width: auto,
  height: auto,
  margin: 2mm,
)

#import "@preview/fletcher:0.5.8" as fletcher: diagram, node, edge, cetz
#import fletcher.shapes: circle, ellipse, cylinder, rect, chevron

#diagram(
  node((0, 0), name: <v1>),
  node((30deg, 2cm), name: <v2>),
  node((330deg, 2cm), name: <v3>),
  edge(<v1>, <v3>),
  edge(<v1>, <v2>),
  edge(<v2>, <v3>),
  edge(<v2>, <v3>, bend: 40deg),
  edge(<v2>, <v3>, bend: -40deg),
)

which does everything else just fine, but when I try to add a line like

edge(<v1>, <v1>, "--|>", loop-angle: 120deg, bend: 100deg),

all it does is place an arrow on top of the vertex. I know, in the manual, the loops only work when the vertex had an actual shape like a circle on it, so perhaps this is the wrong method, but if so, how do I get loops on points to work?

As a secondary question, are there any GUI editors yet for making cetz or fletcher diagrams? I have some much larger diagrams I’d like to make, but it’d be a lot easier ot make via drag-and-drop, and then getting the code for the diagram, something like:

Thanks for the help!

FYI, there is inknertia – Typst Universe. If that misses something, the package can be improved to handle more use cases.

Yes, I did see that one, but from what I saw, it also didn’t have a method for that. Also, I prefer to use a package that provides a more flexibility, and thus I like how fletcher provides an escape hatch to Cetz, while this package doesn’t seem to, at least from what I have seen.

I thought of a solution, but it’s hacky. I’ll mark it as a solution, but I’m not necessarily happy with it.

#set page(
  width: auto,
  height: auto,
  margin: 2mm,
)

#import "@preview/fletcher:0.5.8" as fletcher: diagram, node, edge, cetz
#import fletcher.shapes: circle, ellipse, cylinder, rect, chevron

#diagram(
  node((-0.5cm, 0cm), name: <v0>),
  node((0, 0), name: <v1>),
  node((60deg, 1cm), name: <v2>),
  node((300deg, 1cm), name: <v3>),
  edge(<v1>, <v3>),
  edge(<v1>, <v2>),
  edge(<v2>, <v3>),
  edge(<v2>, <v3>, bend: 25deg),
  edge(<v2>, <v3>, bend: -25deg),
  edge(<v0>, <v1>, bend: -90deg),
  edge(<v0>, <v1>, bend: 90deg),
)

Basically, I create another vertex to act as a second point to form a circle with (v0 and v1) form antipodal points for a circle. The output is:

feynman-diagram-test