Hello everyone,
With Lilaq, I’m having trouble in defining plot labels featuring math mode for display in the legend. Below is a code example of what I’m attempting:
#import "@preview/lilaq:0.6.0" as lq
#import "@preview/zero:0.6.1": set-num

#set page(width: auto, height: auto, margin: 0.5cm, fill: none)
#show lq.selector(lq.diagram): set text(font: "Montserrat", weight: "regular")
#set-num(math: false)

#let x = lq.linspace(0, 10)
#let y = x.map(x => calc.sin(0.1 * x * x))

#show: lq.theme.skyline
#lq.diagram(
  xlabel: "x",
  ylabel: "y",

  lq.plot(x, x => calc.sin(x + 0.541), label: "$f_{one}$"),
  lq.plot(x, x => calc.sin(2*x), label: math.attach("f", b: "two")),
  lq.plot(x, y, label: "function three"),
)
which produces:
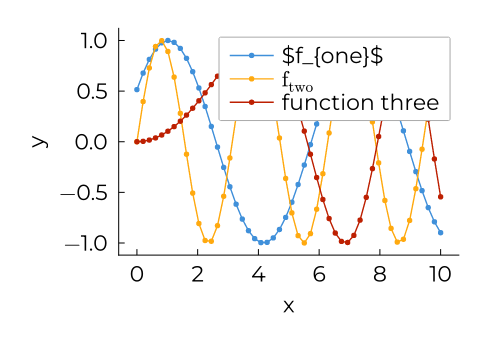
I would expect the first plot to produce a label similar to that of the second one, which I obtained with a workaround by invoking math.attach(...). While the solution works in this case, I wouldn’t know how to proceed if I had to define a more complicated plot label, and I feel like the first syntax is more intuitive. Is the (non-)behavior intentional? If so, what would be the correct way to define math-enabled labels?
Additionally, I noticed that mixing math-mode labels with standard textual ones yields unmatching proportions between the font sizes (e.g. comparing the second and third labels). This remains true even if I use the standard font. I’ve tried playing around with show rules, but wasn’t able to obtain a good-looking result. The only partially satisfying option I found was to manually reduce the font size of text to an arbitrary value, but I’m sure there must be a better way.
I’m very new to Typst in general, so I’m sorry if I’m asking something very obvious, but I really couldn’t figure it out from the docs.
Thanks in advance for any kind of help,
Walter