I am writing a report and I need to draw the following picture. Your help is appreciated. Thank you
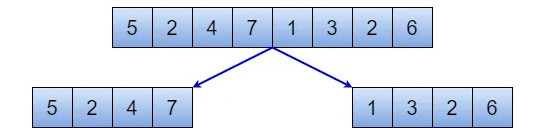
You didn’t specify how exact it needs to be, but CeTZ can do it either way. The only question is the level of abstraction. If you need to generate a merge sort diagram, then I think it’s possible to automate this.
#import "@preview/cetz:0.3.4"
#let item(..numbers) = {
set text(font: "Liberation Sans")
set table(
fill: gradient.linear(angle: 90deg, rgb("#dde8f3"), rgb("#88a8e6")),
stroke: 0.5pt,
inset: 0.6em,
)
table(columns: numbers.pos().len(), ..numbers.pos().map(str))
}
#let edge-color = rgb("#0300bc")
#let style = cetz.draw.set-style(line: (
stroke: edge-color,
mark: (end: (symbol: "stealth", scale: 0.5, fill: edge-color)),
))
#cetz.canvas({
import cetz.draw: *
import cetz.tree
style
tree.tree(spread: 5.5, grow: 1.5, (
item(5, 2, 4, 7, 1, 3, 2, 6),
item(5, 2, 4, 7),
item(1, 3, 2, 6),
))
})
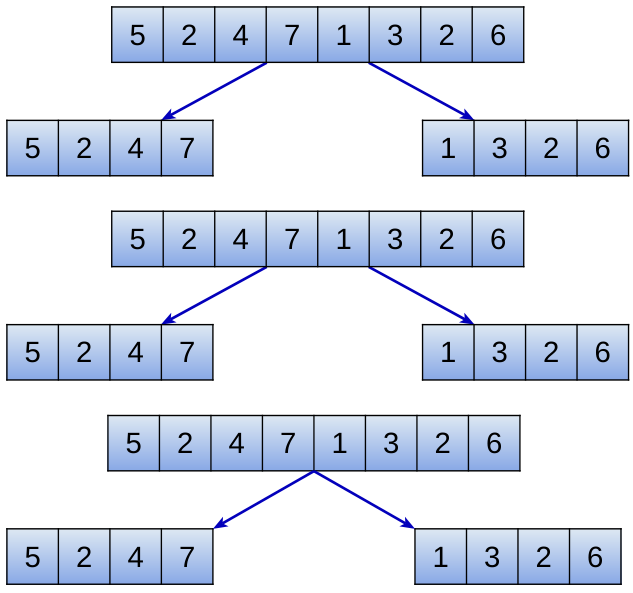
#let half-split(..numbers) = {
let seq = numbers.pos()
let mid = calc.ceil(seq.len() / 2)
(seq.slice(0, mid), seq.slice(mid))
}
#let seq = (5, 2, 4, 7, 1, 3, 2, 6)
#cetz.canvas({
import cetz.draw: *
import cetz.tree
style
tree.tree(spread: 5.5, grow: 1.5, (
item(..seq),
item(..half-split(..seq).first()),
item(..half-split(..seq).last()),
))
})
#cetz.canvas({
import cetz.draw: *
import cetz.tree
style
content((0, 0), name: "root", item(..seq))
let down = -1.5
let side = 2.7
content(
(rel: (-side, down), to: "root"),
item(..half-split(..seq).first()),
name: "l",
)
content(
(rel: (side, down), to: "root"),
item(..half-split(..seq).last()),
name: "r",
)
line("root.south", "l.north-east")
line("root.south", "r.north-west")
})
1 Like
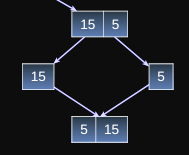
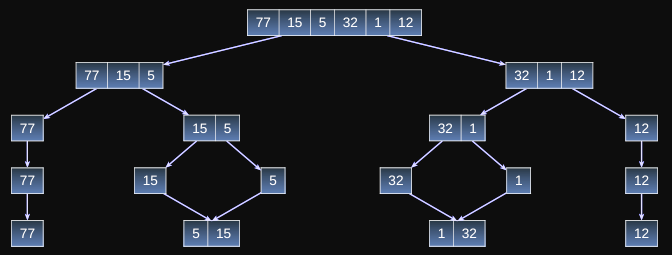
Thank you for your reply. I draw the following graph. I have one problem, in row #3 (counting from top to bottom) how to make nodes
15 and 5 point to the same node (5, 15)? The same problem for node 32 and 1, they shall point to the same node which is
(1, 32). My Typst code is below the picture
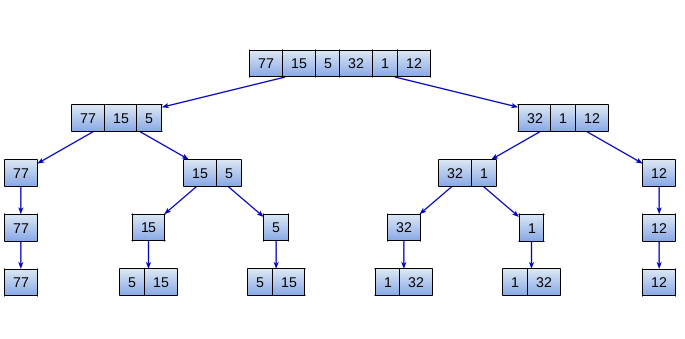
My code looks as follows:
#import "@preview/cetz:0.3.4"

#let item(..numbers) = {
  set text(font: "Liberation Sans")
  set table(
    fill: gradient.linear(angle: 90deg, rgb("#dde8f3"), rgb("#88a8e6")),
    stroke: 0.5pt,
    inset: 0.6em,
  )
  table(columns: numbers.pos().len(), ..numbers.pos().map(str))
}

#let edge-color = rgb("#0300bc")
#let style = cetz.draw.set-style(line: (
  stroke: edge-color,
  mark: (end: (symbol: "stealth", scale: 0.5, fill: edge-color)),
))

#set align(center)

#cetz.canvas({
  import cetz.draw: *
  import cetz.tree
  style
  tree.tree(spread: 3.5, grow: 1.5, (
    item(77, 15, 5, 32, 1, 12),
    (item(77, 15, 5),
      ( item(77), (item(77), item(77)) ),
      ( item(15, 5), (item(15), item(5, 15)), (item(5), item(5, 15) )),
    ),

    (item(32, 1, 12),
      (item(32, 1), (item(32), item(1, 32)), (item(1), item(1, 32))),
      (item(12), (item(12), item(12)) ),
    ),
  ))
})
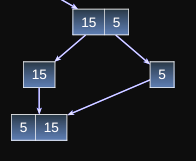
Depending on if you need to center the node.
#let tree = cetz.canvas({
  import cetz.draw: *
  import cetz.tree
  style
  let grow = 1.5
  tree.tree(name: "t", spread: 3.5, grow: grow, (
    item(77, 15, 5, 32, 1, 12),
    (
      item(77, 15, 5),
      (item(77), (item(77), item(77))),
      (
        item(15, 5),
        (item(15), item(5, 15)),
        // item(15),
        item(5),
      ),
    ),
    (
      item(32, 1, 12),
      (item(32, 1), (item(32), item(1, 32)), (item(1), item(1, 32))),
      (item(12), (item(12), item(12))),
    ),
  ))
  line("t.0-0-1-1", (rel: (0.8, 0.35), to: "t.0-0-1-0-0"))
  // anchor("x", (rel: (0, -grow * 2), to: "t.0-0-1"))
  // content("x", item(5, 15))
  // line("t.0-0-1", (rel: (0, 0.35), to: "x"))
})
Full
#import "@preview/cetz:0.3.4"

#let item(..numbers) = {
  set text(font: "Liberation Sans")
  set table(
    fill: gradient.linear(angle: 90deg, rgb("#dde8f3"), rgb("#88a8e6")),
    stroke: 0.5pt,
    inset: 0.6em,
  )
  table(columns: numbers.pos().len(), ..numbers.pos().map(str))
}

#let edge-color = rgb("#0300bc")
#let style = cetz.draw.set-style(line: (
  stroke: edge-color,
  mark: (end: (symbol: "stealth", scale: 0.5, fill: edge-color)),
))

#let tree = cetz.canvas({
  import cetz.draw: *
  import cetz.tree
  style
  let grow = 1.5
  tree.tree(name: "t", spread: 3.5, grow: grow, (
    item(77, 15, 5, 32, 1, 12),
    (
      item(77, 15, 5),
      (item(77), (item(77), item(77))),
      (
        item(15, 5),
        (item(15), item(5, 15)),
        // item(15),
        item(5),
      ),
    ),
    (
      item(32, 1, 12),
      (item(32, 1), (item(32), item(1, 32)), (item(1), item(1, 32))),
      (item(12), (item(12), item(12))),
    ),
  ))
  line("t.0-0-1-1", (rel: (0.8, 0.35), to: "t.0-0-1-0-0"))
  // anchor("x", (rel: (0, -grow * 2), to: "t.0-0-1"))
  // content("x", item(5, 15))
  // line("t.0-0-1", (rel: (0, 0.35), to: "x"))
})


#figure(tree)
#let tree = cetz.canvas({
  import cetz.draw: *
  import cetz.tree
  style
  let grow = 1.5
  tree.tree(name: "t", spread: 3.5, grow: grow, (
    item(77, 15, 5, 32, 1, 12),
    (
      item(77, 15, 5),
      (item(77), (item(77), item(77))),
      (
        item(15, 5),
        // (item(15), item(5, 15)),
        item(15),
        item(5),
      ),
    ),
    (
      item(32, 1, 12),
      (item(32, 1), (item(32), item(1, 32)), (item(1), item(1, 32))),
      (item(12), (item(12), item(12))),
    ),
  ))
  // line("t.0-0-1-1", (rel: (0.8, 0.35), to: "t.0-0-1-0-0"))
  anchor("x", (rel: (0, -grow * 2), to: "t.0-0-1"))
  content("x", item(5, 15))
  line("t.0-0-1-0", (rel: (0, 0.35), to: "x"))
  line("t.0-0-1-1", (rel: (0, 0.35), to: "x"))
})
Full
#import "@preview/cetz:0.3.4"

#let item(..numbers) = {
  set text(font: "Liberation Sans")
  set table(
    fill: gradient.linear(angle: 90deg, rgb("#dde8f3"), rgb("#88a8e6")),
    stroke: 0.5pt,
    inset: 0.6em,
  )
  table(columns: numbers.pos().len(), ..numbers.pos().map(str))
}

#let edge-color = rgb("#0300bc")
#let style = cetz.draw.set-style(line: (
  stroke: edge-color,
  mark: (end: (symbol: "stealth", scale: 0.5, fill: edge-color)),
))

#let tree = cetz.canvas({
  import cetz.draw: *
  import cetz.tree
  style
  let grow = 1.5
  tree.tree(name: "t", spread: 3.5, grow: grow, (
    item(77, 15, 5, 32, 1, 12),
    (
      item(77, 15, 5),
      (item(77), (item(77), item(77))),
      (
        item(15, 5),
        // (item(15), item(5, 15)),
        item(15),
        item(5),
      ),
    ),
    (
      item(32, 1, 12),
      (item(32, 1), (item(32), item(1, 32)), (item(1), item(1, 32))),
      (item(12), (item(12), item(12))),
    ),
  ))
  // line("t.0-0-1-1", (rel: (0.8, 0.35), to: "t.0-0-1-0-0"))
  anchor("x", (rel: (0, -grow * 2), to: "t.0-0-1"))
  content("x", item(5, 15))
  line("t.0-0-1-0", (rel: (0, 0.35), to: "x"))
  line("t.0-0-1-1", (rel: (0, 0.35), to: "x"))
})


#figure(tree)
#import "@preview/cetz:0.3.4"

#let item(..numbers) = {
  set text(font: "Liberation Sans")
  set table(
    fill: gradient.linear(angle: 90deg, rgb("#dde8f3"), rgb("#88a8e6")),
    stroke: 0.5pt,
    inset: 0.6em,
  )
  table(columns: numbers.pos().len(), ..numbers.pos().map(str))
}

#let edge-color = rgb("#0300bc")
#let style = cetz.draw.set-style(line: (
  stroke: edge-color,
  mark: (end: (symbol: "stealth", scale: 0.5, fill: edge-color)),
))

#let tree = cetz.canvas({
  import cetz.draw: *
  import cetz.tree
  style
  let grow = 1.5
  tree.tree(name: "t", spread: 3.5, grow: grow, (
    item(77, 15, 5, 32, 1, 12),
    (
      item(77, 15, 5),
      (item(77), (item(77), item(77))),
      (
        item(15, 5),
        item(15),
        item(5),
      ),
    ),
    (
      item(32, 1, 12),
      (
        item(32, 1),
        item(32),
        item(1),
      ),
      (item(12), (item(12), item(12))),
    ),
  ))

  anchor("x", (rel: (0, -grow * 2), to: "t.0-0-1"))
  content("x", item(5, 15))
  line((rel: (-2, grow), to: "x"), (rel: (0, 0.35), to: "x"))
  line((rel: (2, grow), to: "x"), (rel: (0, 0.35), to: "x"))

  anchor("x", (rel: (0, -grow * 2), to: "t.0-1-0"))
  content("x", item(1, 32))
  line((rel: (-2, grow), to: "x"), (rel: (0, 0.35), to: "x"))
  line((rel: (2, grow), to: "x"), (rel: (0, 0.35), to: "x"))
})


#figure(tree)
I’m not sure if it’s flexible enough by itself.
Cc @jwolf
2 Likes
Well, CeTZ’s tree layout will obviously no longer work when you no longer work with a tree-shaped graph. I suspected that you’d eventually want to merge branches, but as your title indicates a tree that was not evident.
In this case you’ll probably want to use Fletcher. Here’s how this could look:
#import "@preview/fletcher:0.5.8"

#let item(..numbers) = {
  set text(font: "Liberation Sans")
  set table(
    fill: gradient.linear(angle: 90deg, rgb("#dde8f3"), rgb("#88a8e6")),
    stroke: 0.5pt,
    inset: 0.6em,
  )
  table(columns: numbers.pos().len(), ..numbers.pos().map(str))
}

#let edge-color = rgb("#0300bc")

#set align(center)

#fletcher.diagram(
  spacing: (0em, 2em),
  node-shape: rect,
  node-inset: 0pt,
  edge-stroke: 1pt+edge-color,
  {
    import fletcher: node, edge
    let edge = edge.with(marks: "-}>")

    node((0, 0), item(77, 15, 5, 32, 1, 12))

    node((-4, 1), item(77, 15, 5))
    node((4, 1), item(32, 1, 12))

    node((-5, 2), item(77))
    node((-2, 2), item(15, 5))
    node((2, 2), item(32, 1))
    node((5, 2), item(12))

    node((-5, 3), item(77))
    node((-3, 3), item(15))
    node((-1, 3), item(5))
    node((1, 3), item(32))
    node((3, 3), item(1))
    node((5, 3), item(12))

    node((-5, 4), item(77))
    node((-2, 4), item(5, 15))
    node((2, 4), item(1, 32))
    node((5, 4), item(12))

    node((-4, 5), item(5, 15, 77))
    node((4, 5), item(1, 12, 32))

    node((0, 6), item(1, 5, 12, 15, 32, 77))

    edge((0, 0), (-4, 1))
  },
)
(adding the other edges is left as an exercise to the reader ![]() ) I took the manual way and specified all the coordinates myself, but you could probably be smarter about it. (I’m the kind of person who would probably implement a merge sort in Typst so that the algorithm can build the visualization itself).
) I took the manual way and specified all the coordinates myself, but you could probably be smarter about it. (I’m the kind of person who would probably implement a merge sort in Typst so that the algorithm can build the visualization itself).
One thing to consider with Fletcher is that it uses “elastic coordinates” by default. That is the reason why, for example, there’s a big empty space in the middle that’s as wide as the original list: that list is at x coordinate 0, and nodes at coordinates -1 and 1 won’t overlap with that space. You could try to be smarter about the layout than what I did here by using absolute coordinates. The fletcher manual explains the different kinds of coordinates (and more, of course).
2 Likes
Sorry! That was me renaming the topic from “How to draw this picture?”. I will remove the word tree.
2 Likes