How to draw a vertical line across grid cells?

I have the following code to show a modulo 2 binary division:

$std.grid(
  inset: #3pt,
  columns: #19,
  , , , , , , , , , 1, 1, 0, 1, 0, 0, 0, 0, 0,
  #grid.hline(start: 5),
  , 1, 1, 0, 0, 1,
  #grid.vline(start: 1, end: 2),
  1, 0, 1, 1, 0, 1, 0, 1, 0, 0, 0, 0, 0,
  , , , , , xor, 1, 1, 0, 0, 1, arrow.b, arrow.b, arrow.b, arrow.b, arrow.b, arrow.b, arrow.b, arrow.b,
  #grid.hline(start: 5, end: 10),
  , , , , , , 0, 1, 1, 1, 1, 1, arrow.b, arrow.b, arrow.b, arrow.b, arrow.b, arrow.b, arrow.b,
  , , , , , , xor, 1, 1, 0, 0, 1, arrow.b, arrow.b, arrow.b, arrow.b, arrow.b, arrow.b, arrow.b,
  #grid.hline(start: 6, end: 11),
  , , , , , , , 0, 0, 1, 1, 0, 0, 1, arrow.b, arrow.b, arrow.b, arrow.b, arrow.b,
  , , , , , , , , xor, 1, 1, 0, 0, 1, arrow.b, arrow.b, arrow.b, arrow.b, arrow.b,
  #grid.hline(start: 8, end: 13),
  , , , , , , , , , 0, 0, 0, 0, 0, 0, 0, 0, 0, 0,
)$

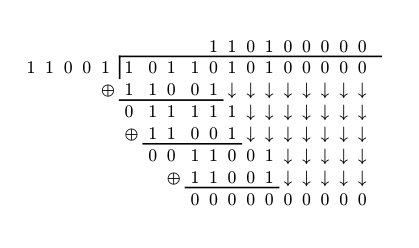
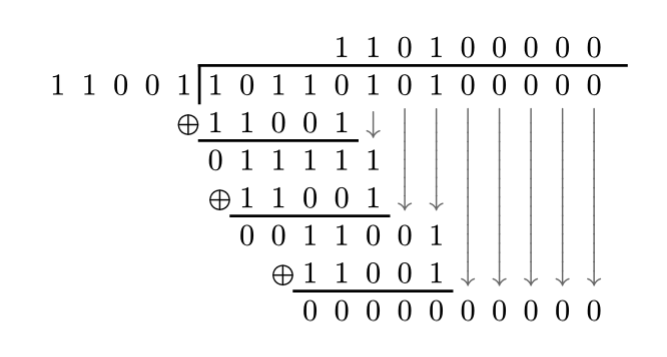
I want to know if it is possible to show a vertical line inside each cell to make it look better when showing that a number is being pulled down. Currently, this is what it looks like when rendered:

Hi, welcome!

You can use the rowspan parameter. If you haven’t read that Table Guide yet, I suggest taking a glance.

#let pull-down(n) = grid.cell(
  rowspan: n,
  align: horizon,
  {
    set text(luma(40%))
    $stretch(arrow.b, size: #{ 100% + (n - 1) * 140% })$
  },
)

Full code
#let pull-down(n) = grid.cell(
  rowspan: n,
  align: horizon,
  {
    set text(luma(40%))
    $stretch(arrow.b, size: #{ 100% + (n - 1) * 140% })$
  },
)

$std.grid(
  inset: #3pt,
  columns: #19,
  , , , , , , , , , 1, 1, 0, 1, 0, 0, 0, 0, 0,
  #grid.hline(start: 5),
  , 1, 1, 0, 0, 1,
  #grid.vline(start: 1, end: 2),
  1, 0, 1, 1, 0, 1, 0, 1, 0, 0, 0, 0, 0,
  , , , , , xor, 1, 1, 0, 0, 1, #pull-down(1), #pull-down(3), #pull-down(3), #pull-down(5), #pull-down(5), #pull-down(5), #pull-down(5), #pull-down(5),
  #grid.hline(start: 5, end: 10),
  , , , , , , 0, 1, 1, 1, 1, 1,
  , , , , , , xor, 1, 1, 0, 0, 1,
  #grid.hline(start: 6, end: 11),
  , , , , , , , 0, 0, 1, 1, 0, 0, 1,
  , , , , , , , , xor, 1, 1, 0, 0, 1,
  #grid.hline(start: 8, end: 13),
  , , , , , , , , , 0, 0, 0, 0, 0, 0, 0, 0, 0, 0,
)$
4 Likes

Thanks for the solution!

I knew about rowspan, but I did not know about stretch, that’s what I was missing.
Also didn’t notice the table guide before.
Thanks for pointing me in the right direction!

1 Like