Does anyone know if there is a way to nicely align cetz content vertically using a tabular/grid-like format.
For example in tikz a matrix let’s you do this, with controllable column separation and other settings.
For clarity, I want the content of each ‘cell’ to be completely mutable/custom, the below is of course a very simple case.
You can use the package fletcher – Typst Universe to create such a diagram. The spacing allows you to control the column and row separation, and there are many other settings to modify the formatting.
#import "@preview/fletcher:0.5.8" as fletcher: diagram, node, edge

#let matrix = (
  (8, 1, 6),
  (3, 5, 7),
  (4, 9, 2),
)

#let nodes = matrix.enumerate().map(
  ((y, row)) => {
    row.enumerate().map(((x, v)) => { node((x, y), $#v$) })
  }
)

#diagram(
  spacing: (1cm, 4pt),
  node-stroke: red,
  node-shape: rect,
  ..nodes.flatten(),
  node(enclose: ((0, 0), (2, 2)), inset: 4pt)
)
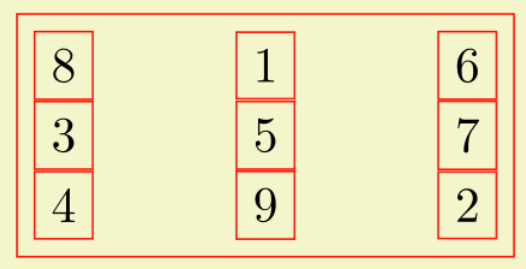
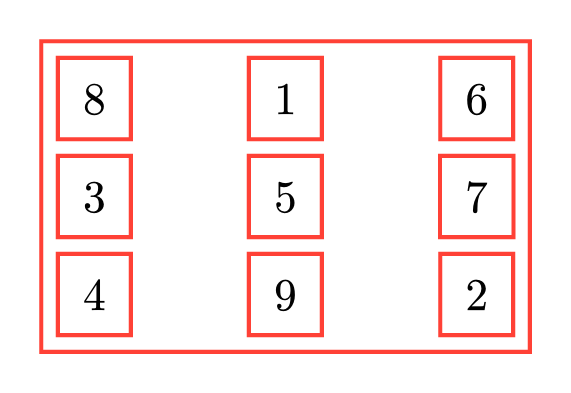
This is what the output of the code above looks like
2 Likes