Is there a way in which I should run benchmarks in the web app? I have a piece of code that I want to test whether it is faster or not (discussion in Calculate `cubic-extrema` inside WebAssembly by rikhuijzer · Pull Request #846 · cetz-package/cetz · GitHub).
I’m now exporting the timing via “Help → Debug → Restart and start profiling”. What I do is I click on that “Restart and start profiling”, then I wait till the spinner stops spinning above the preview and click on “Stop” in the profiling pop up at the bottom of the screen.
Next, I load this json file in https://ui.perfetto.dev/ and check the results there. This mostly is straightforward, but I’m confused about the eval block.
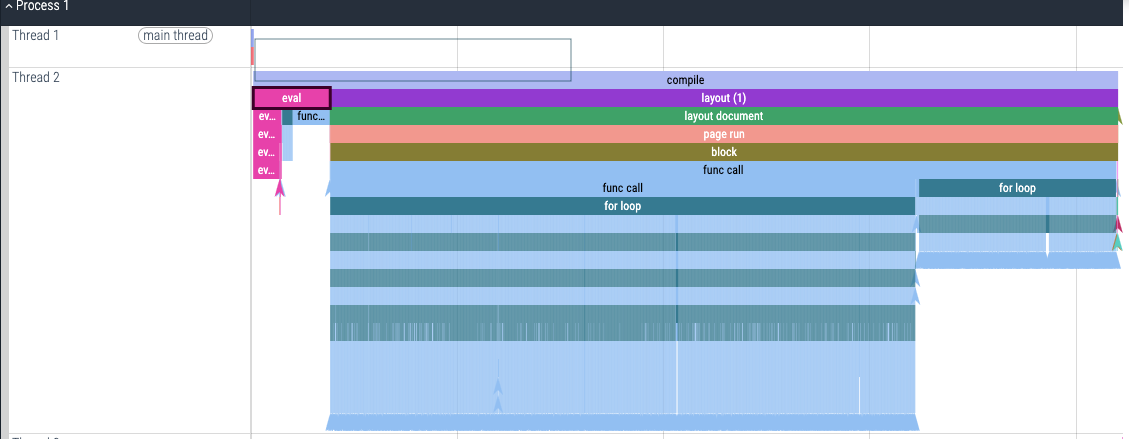
Sometimes this eval takes much longer than other times. Is there just a lot of random variation in the eval? Or should I just look at the full compile time? Or will the eval part fall away on incremental compilations and can I thus ignore it? Or should I benchmark differently? Or maybe the eval just depends on how fast I click “Stop” after the compilation is finished?