Since your post effectively contains three questions, I will try to answer them one by one.
What is your parent container?
The default parent container is your page, but you can have other containers such as blocks or grid cells. In any case, relative lengths (e.g. 35%) are evaluated relative to the size of this container. You can find a nice explanation here https://typst.app/docs/reference/layout/relative/#relative-to-the-page.
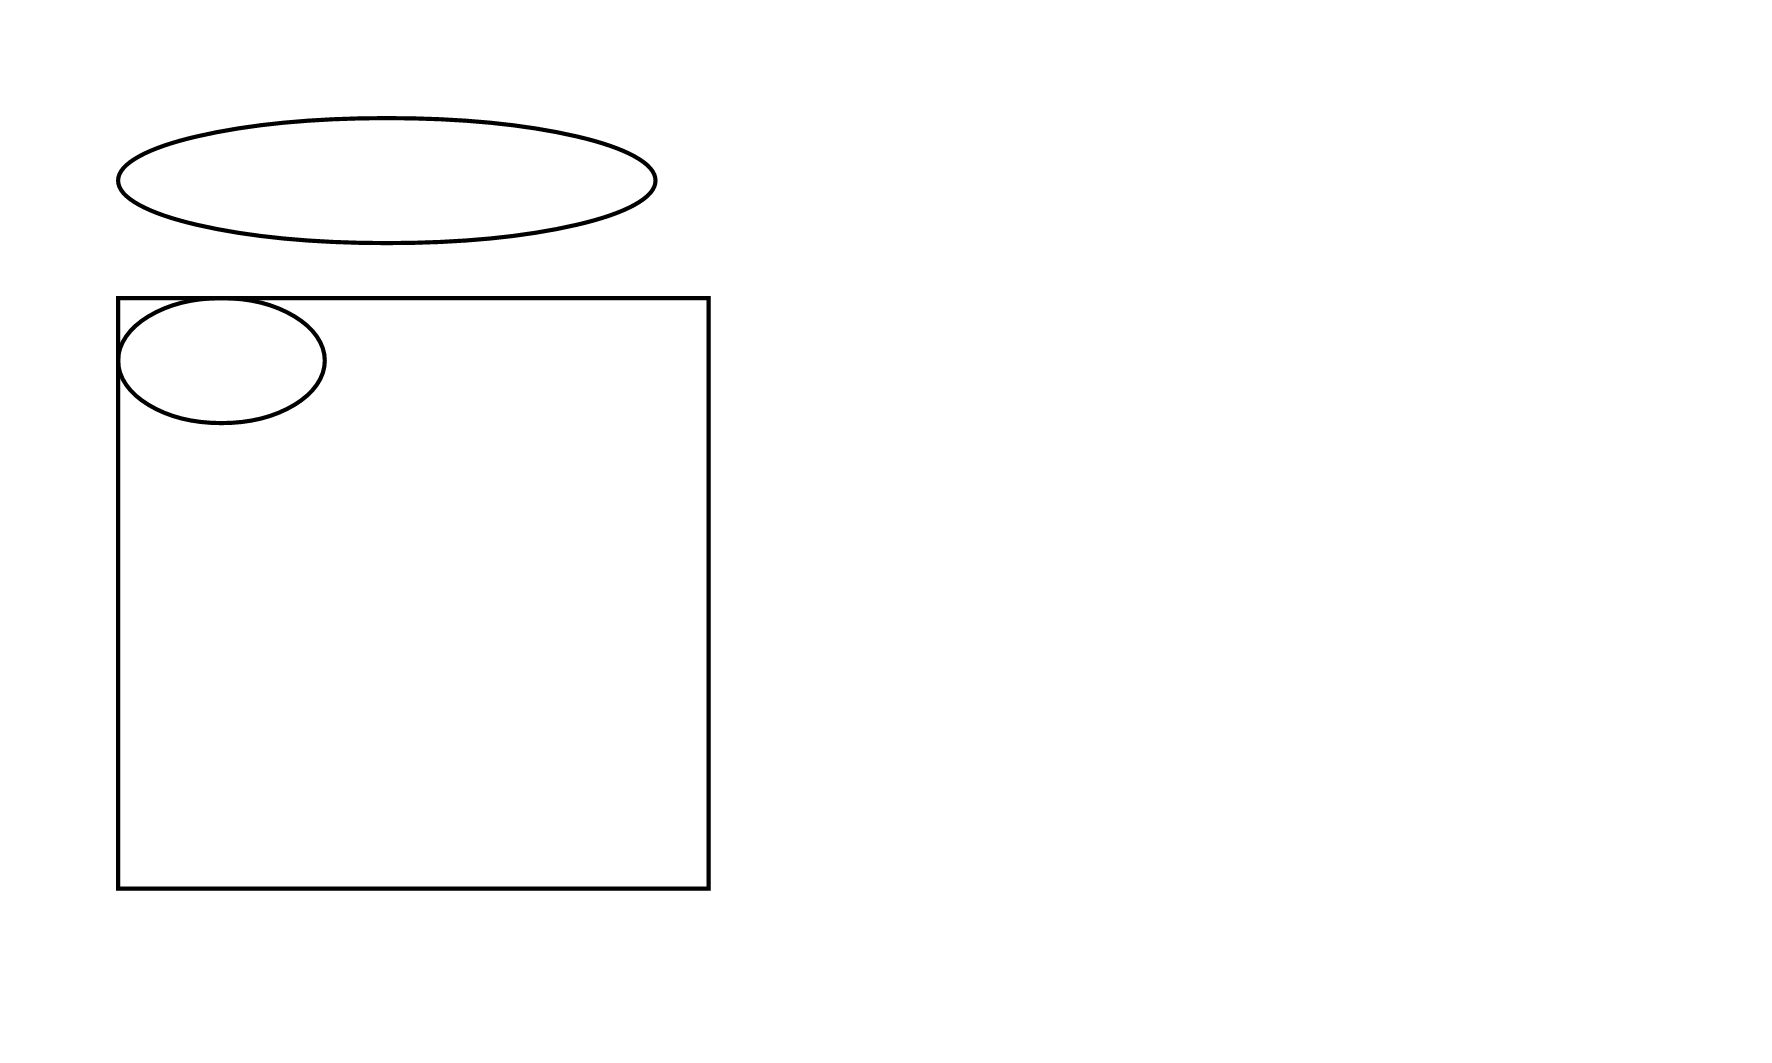
To illustrate this, see this example where I use the same (relative) size for the two ellipses but the second one is in a block element with a fixed size.
#set page(width: 15cm, height: 9cm, margin: 1cm)

#ellipse(width: 35%, height: 30pt)
#block(width: 5cm, height: 5cm, stroke: black, ellipse(width: 35%, height: 30pt))
Two ellipses with different parent containers
How do I get a tall ellipse?
While the example for the ellipse uses a relative length for the width, you can specify any length you want. To get a tall ellipse, just specify an absolute width that is smaller than the height, e.g. ellipse(width: 1cm, height: 2cm).
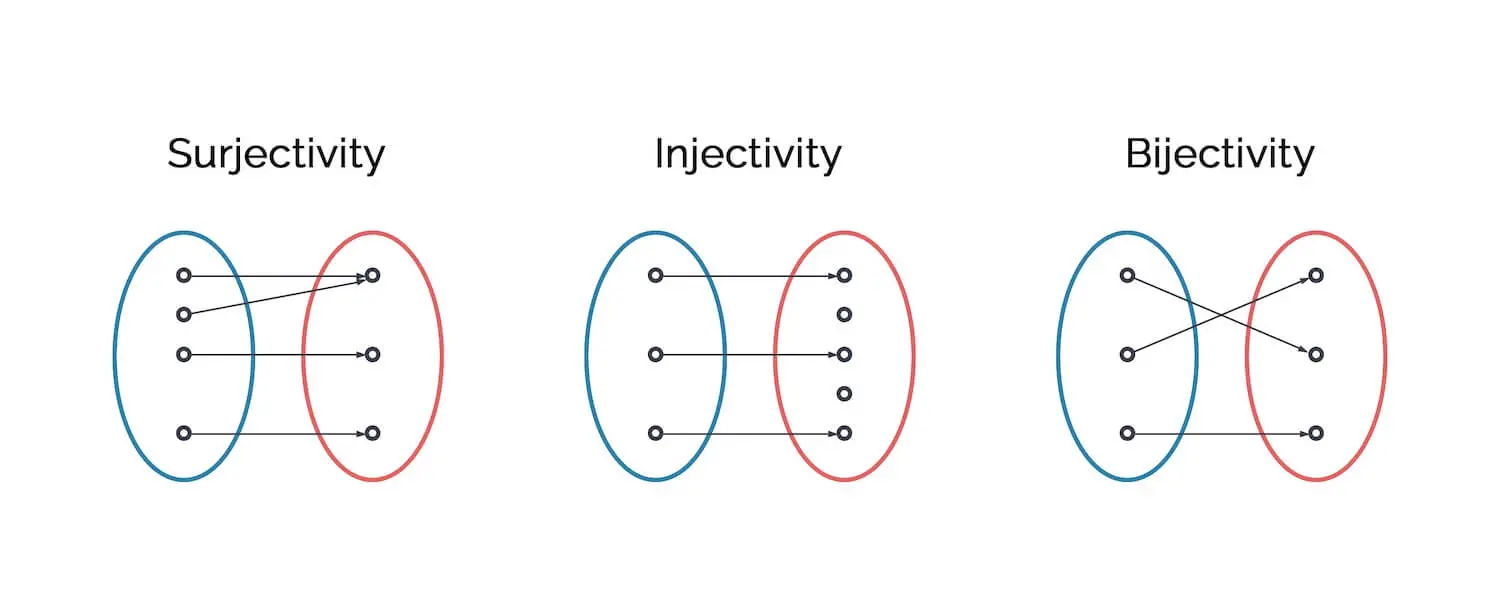
How do I draw the diagram using native Typst?
Drawing such a diagram in native Typst is a bit tricky. You have to work with Place - Typst Documentation a lot to make the different elements to overlap. I prepared one of the diagrams as an example. Only the arrow tips are still missing, I would really recommend using a package for this. If you want to stick to native Typst for the rest of the drawing, you can take a look at tiptoe – Typst Universe for the arrows.
Here is the code for the drawing
#set page(width: 10cm, height: 5cm, margin: 1cm)

#let height = 2cm
#let width = 1cm
#let x0 = 0cm
#let x1 = 1.5cm

#let dot-radius = 0.4mm
#let dot = circle(radius: dot-radius, stroke: 0.5pt)

#{
  place(dx: (x0 + x1) / 2 + width / 2,  place(center, text("Surjectivity")))
  place(dx: x0, dy: 1cm, ellipse(height: height, width: width, stroke: blue))
  place(dx: x1, dy: 1cm, ellipse(height: height, width: width, stroke: red))
  for (y0, y1) in ((-2, -2), (-1, -2), (0, 0), (2, 2)) {
    let x0 = x0 + width / 2
    let x1 = x1 + width / 2
    let y0 = (2 + y0/3) * height / 2
    let y1 = (2 + y1/3) * height / 2
    place(line(start: (x0, y0), end: (x1, y1), stroke: 0.5pt))
  }
  for y in (-2, -1, 0, 2) {
    let dx = x0 + width / 2 - dot-radius
    let dy = (2 + y/3) * height / 2 - dot-radius
    place(dx: dx, dy: dy, dot)
  }
  for y in (-2, 0, 2) {
    let dx = x1 + width / 2 - dot-radius
    let dy = (2 + y/3) * height / 2 - dot-radius
    place(dx: dx, dy: dy, dot)
  }
}
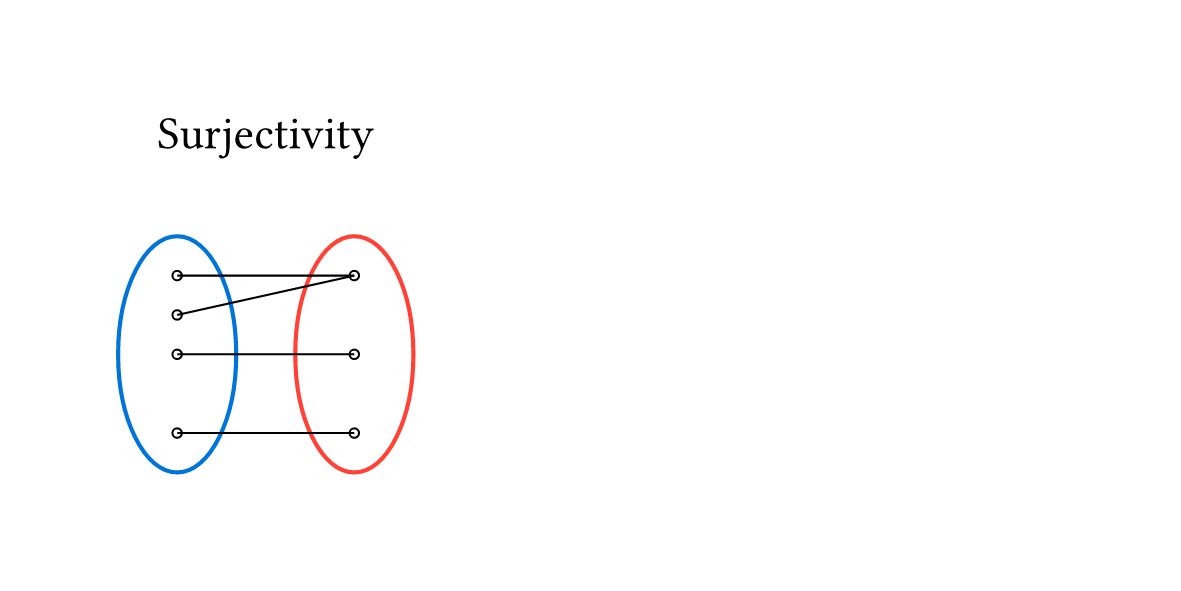
And this is what the drawing looks like
How would I draw such a diagram?
The right tool for this purpose is definitely the package cetz – Typst Universe. Unless there is a reason why you need/want to create the drawing without packages, I would definitely recommend using CeTZ here. This package allows you to draw on a canvas without having to worry about manually placing elements.
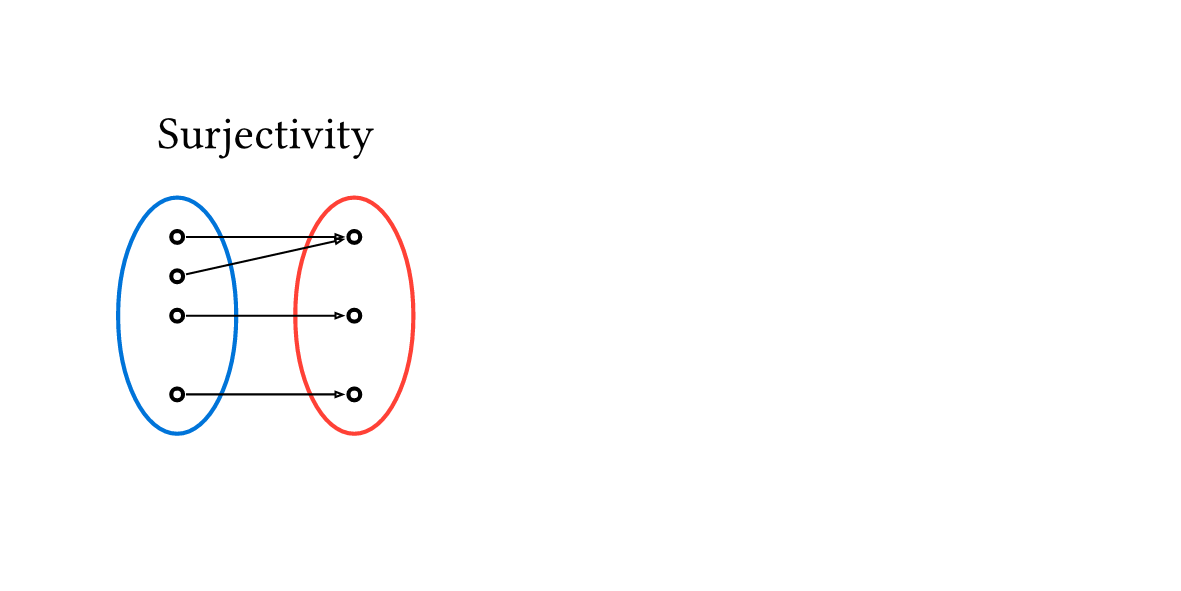
Here is what the code looks like when using CeTZ
#import "@preview/cetz:0.5.2"

#set page(width: 10cm, height: 5cm, margin: 1cm)

#cetz.canvas({
  import cetz.draw: *

  circle((0, 0), radius: (0.5, 1), name: "left", stroke: blue)
  circle((1.5, 0), radius: (0.5, 1), name: "right", stroke: red)
  content((0.75, 1.5), text("Surjectivity"))

  for y in (-2, 0, 1, 2) { circle((rel: (0, y/3), to: "left.center"), radius: 0.05) }
  for y in (-2, 0, 2) { circle((rel: (0, y/3), to: "right.center"), radius: 0.05) }
  for (y0, y1) in ((-2, -2), (0, 0), (1, 2), (2, 2)) {
    let p0 = (rel: (0, y0/3), to: "left.center")
    let p1 = (rel: (0, y1/3), to: "right.center")
    let pad = 5%
    line((p0, pad, p1), (p0, 100% - pad, p1), stroke: 0.5pt, mark: (end: ">", scale: 0.3))
  }
})
And this is the resulting drawing