Hi Guys,
Is there any ongoing project on 3D plots in Typst? I believe this feature would be very amazing.
For latex, there are tiki and pgfplots, and I would like to find alternatives of them in Typst.
Hi Guys,
Is there any ongoing project on 3D plots in Typst? I believe this feature would be very amazing.
For latex, there are tiki and pgfplots, and I would like to find alternatives of them in Typst.
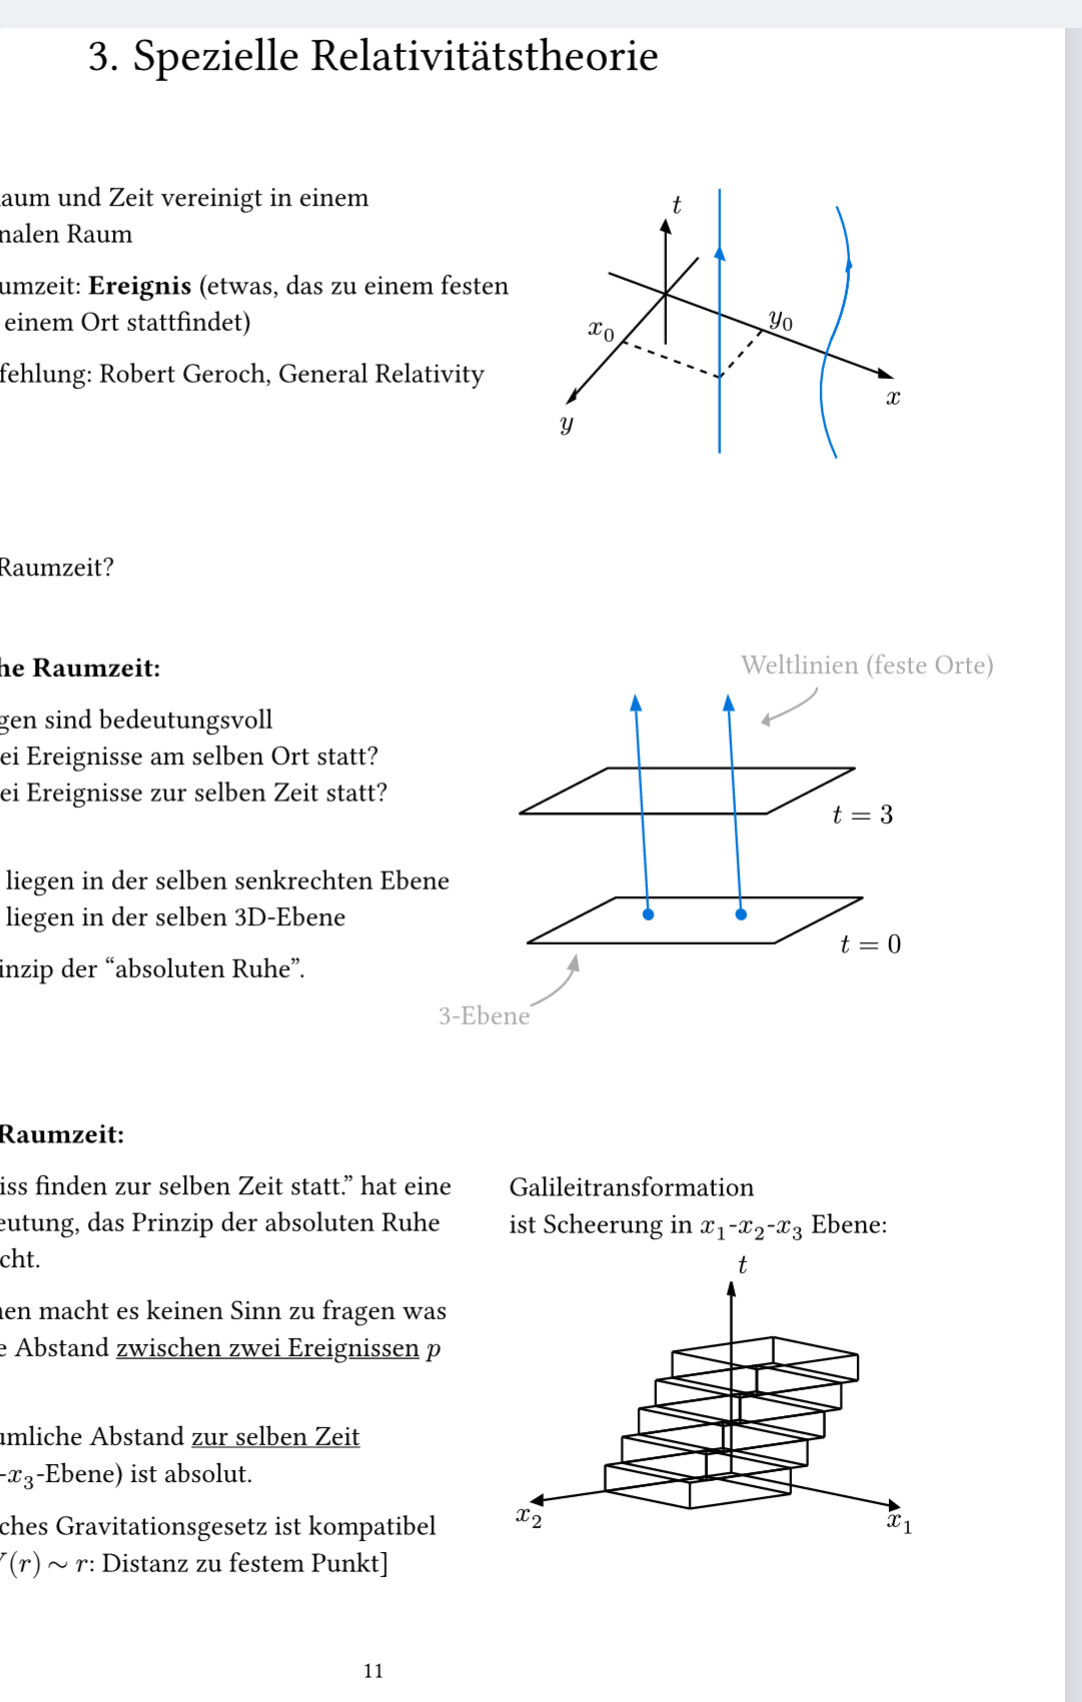
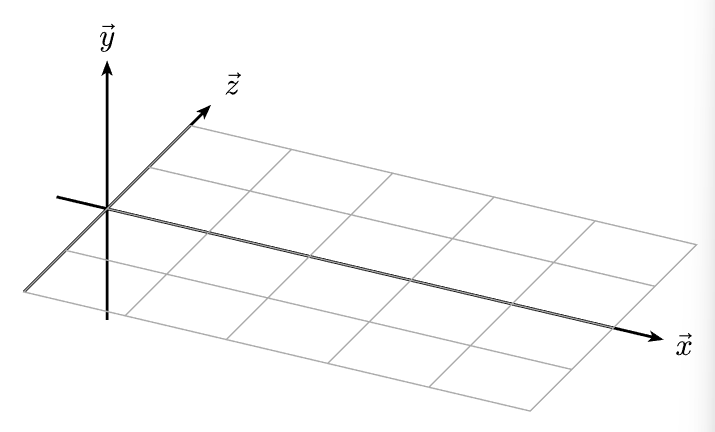
You are probably looking for surface plots in 3d but for anyone that is just looking for a way to draw other 3d objects, cetz supports (x,y,z) coordinates:
Hello @robinDrone, I have renamed your post to “How to plot 3D data?”. If that’s not your topic, please modify it accordingly! I also moved it to the Questions category ![]()
There has been a recent show case on Discord (not mine):
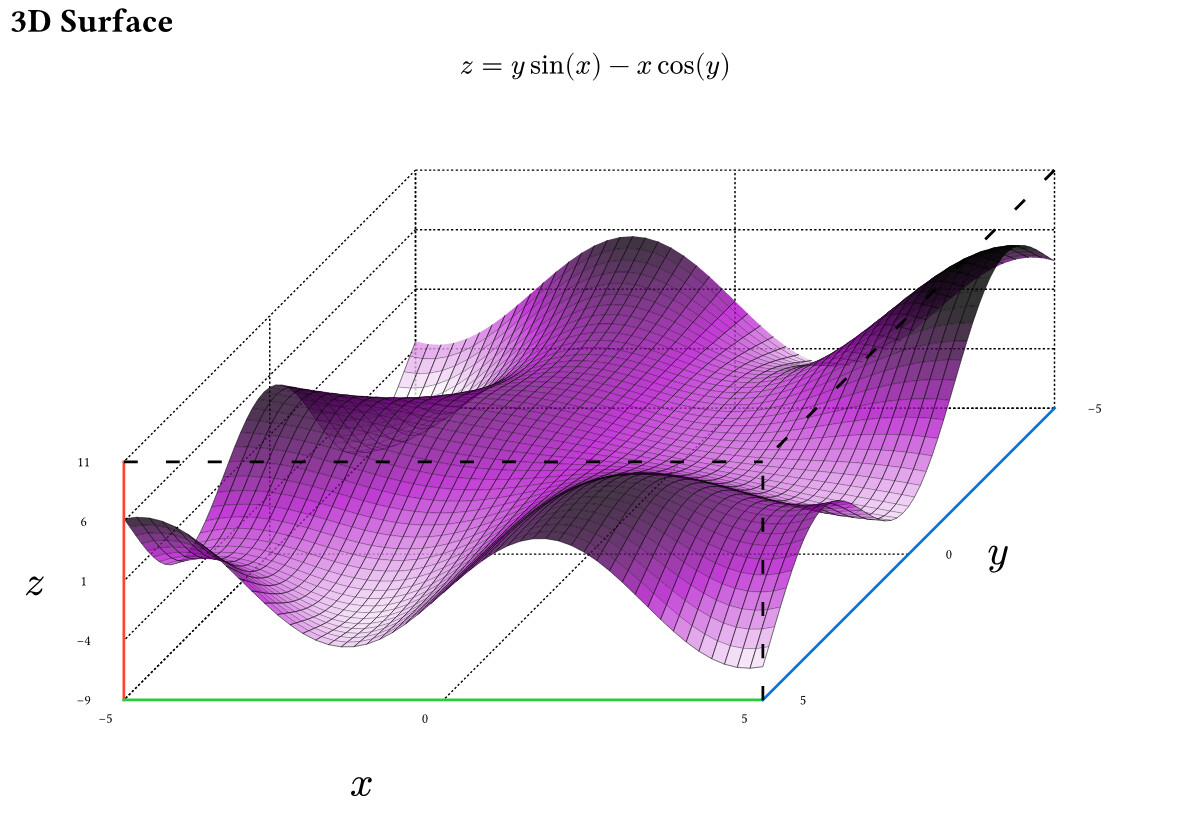
Example from the README:
#import "@preview/plotsy-3d:0.1.0": *

#let size = 5
#let scale_factor = 0.3x
#let (xscale,yscale,zscale) = (0.3,0.3,0.05)

#let func(x,y) = y*calc.sin(x) -x*calc.cos(y)
#let color_func(x, y, z, x_lo,x_hi,y_lo,y_hi,z_lo,z_hi) = {
  return purple.transparentize(20%).darken((z/(z_hi - z_lo)) * 300%)
}
// for all options see the library file
#plot_3d_surface(
    func,
    color_func: color_func,
    subdivisions: 5,
    subdivision_mode: "increase",
    scale_dim: (xscale*scale_factor,yscale*scale_factor, zscale*scale_factor),
    xdomain: (-size,size), // plotting domain
    ydomain:  (-size,size), // plotting domain
    pad_high: (0,0,2), // increase axis size higher than domain
    pad_low: (0,0,0), // increase axis size lower than domain
    axis_label_offset: (0.2,0.1,0.1), // move the x y z further from axis
    axis_text_offset: 0.045, // move the numbers further from axis
)
Would you happen to have a code snippet from any of these diagrams?
Edited* I found this:
// adapted from https://github.com/cetz-package/cetz/blob/a082e02a/gallery/waves.typ
#import "@preview/cetz:0.5.1": canvas, draw, matrix
#import draw: content, grid, line, scale, set-transform

#set page(width: auto, height: auto, margin: .5cm)

#canvas({
  // Set up the transformation matrix
  set-transform(matrix.transform-rotate-dir((1, 1, -1.3), (0, 1, .4)))
  scale(x: 1.5, y:1,z: 1)

  let arrow-style = (mark: (end: "stealth", fill: black, scale: 0.5))
  // Coordinate axes labels and arrows
  draw.line((0, -2, 0), (0, 2.5, 0), ..arrow-style)
  draw.line((-0.5, 0, 0), (5.5, 0, 0), ..arrow-style)
  draw.line((0, 0, -1.5), (0, 0, 2), ..arrow-style)
  content((0, 0, 2.3), [$arrow(y)$])
  content((0, 3, 0), [$arrow(z)$])
  content((5.7, 0, 0), [$arrow(x)$])
  grid(
    (0, -2),
    (5, 2),
    stroke: gray + .5pt,
  )
})