How to plot time-series charts using Lilaq?

HI everyone,
This is my first interaction with this forum :)

I want to know how could i plot time-series charts using lilaq, if its is possible.

As you can guess i need datetime on x-axis and numerical values on the y-axis.

I tried converting the datetime to integer and then plotting against that but in vain.

I would prefer not to convert the datetimes to string since i also require to visualize the change in frequency in certain graphs.

This can be considered a small example which i am trying to get working and will eventually be programatically generating the graphs through an API.
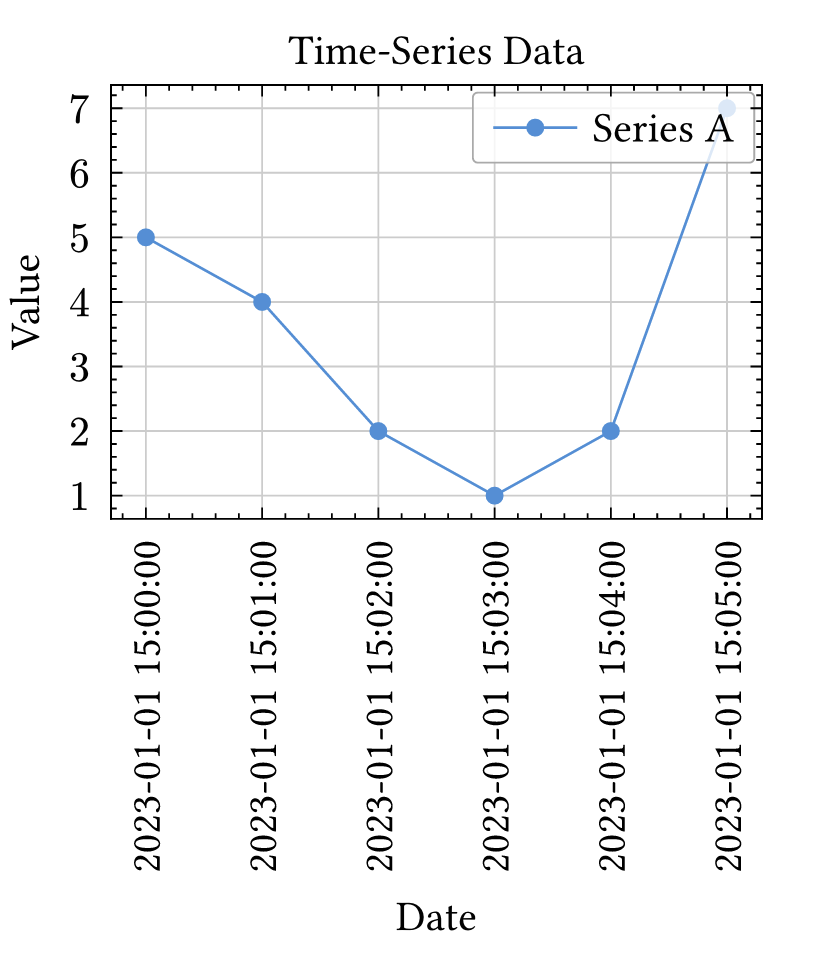
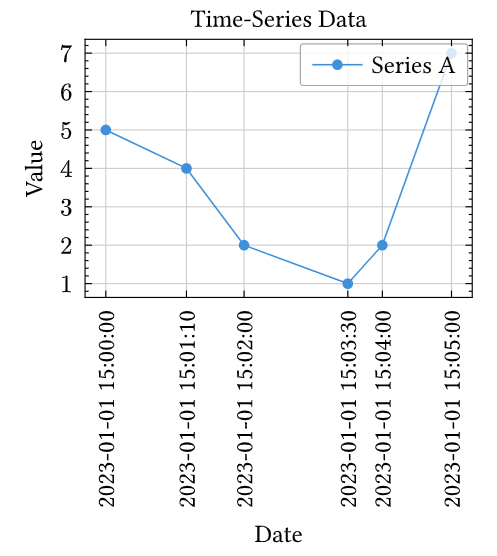
#let dates = (
  datetime(year: 2023, month: 1, day: 1, hour: 15, minute: 00, second: 00),
  datetime(year: 2023, month: 1, day: 1, hour: 15, minute: 01, second: 00),
  datetime(year: 2023, month: 1, day: 1, hour: 15, minute: 02, second: 00),
  datetime(year: 2023, month: 1, day: 1, hour: 15, minute: 03, second: 00),
  datetime(year: 2023, month: 1, day: 1, hour: 15, minute: 04, second: 00),
  datetime(year: 2023, month: 1, day: 1, hour: 15, minute: 05, second: 00),
)

#let values = (5, 4, 2, 1, 2, 7)

#lq.diagram(
  title: [Time-Series Data],
  xlabel: [Date],
  ylabel: [Value],
  xticks: dates.map(d => d.display()),
  lq.plot(dates, values, mark: "o", label: [Series A]),
)

any help or guidance would be appreciated, thanks!

1 Like

I think there is a few things you can do. For the lq.plot you can just generate x-values in the range from zero to the length of your dates with array.range.

For the ticks, you can then sort the dates such that they correspond to the correct x-tick and display them with the xaxis parameter like here:

#import "@preview/lilaq:0.2.0" as lq 

#let dates = (
  datetime(year: 2023, month: 1, day: 1, hour: 15, minute: 01, second: 00),
  datetime(year: 2023, month: 1, day: 1, hour: 15, minute: 00, second: 00),
  datetime(year: 2023, month: 1, day: 1, hour: 15, minute: 02, second: 00),
  datetime(year: 2023, month: 1, day: 1, hour: 15, minute: 03, second: 00),
  datetime(year: 2023, month: 1, day: 1, hour: 15, minute: 04, second: 00),
  datetime(year: 2023, month: 1, day: 1, hour: 15, minute: 05, second: 00),
).sorted()

#let values = (5, 4, 2, 1, 2, 7)

#lq.diagram(
  title: [Time-Series Data],
  xlabel: [Date],
  ylabel: [Value],
  xaxis: (ticks: dates.map(d => rotate(-90deg, reflow: true, d.display())).enumerate()),
  lq.plot(range(dates.len()), values, mark: "o", label: [Series A]),
)

2 Likes

I would move this long part into a named closure:

#let make-label = date => rotate(-90deg, reflow: true, date.display())

and do

  xaxis: (ticks: dates.map(make-label).enumerate()),

I’ll also point out that numbers don’t need a leading zero:

  datetime(year: 2023, month: 1, day: 1, hour: 15, minute: 1, second: 0),

Hello @swarnim !

If your times are evenly spaced, the solution by @xkevio and @Andrew seems the right one for me. If the times were not evenly spaced, you could do the following:

#let dates = (
  datetime(year: 2023, month: 1, day: 1, hour: 15, minute: 01, second: 10),
  datetime(year: 2023, month: 1, day: 1, hour: 15, minute: 00, second: 00),
  datetime(year: 2023, month: 1, day: 1, hour: 15, minute: 02, second: 00),
  datetime(year: 2023, month: 1, day: 1, hour: 15, minute: 03, second: 30),
  datetime(year: 2023, month: 1, day: 1, hour: 15, minute: 04, second: 00),
  datetime(year: 2023, month: 1, day: 1, hour: 15, minute: 05, second: 00),
).sorted()

#let values = (5, 4, 2, 1, 2, 7)


// This is an arbitrary reference time, it doesn't really matter which one
#let reference-time = datetime(year: 0, month: 1, day: 1, hour: 0, minute: 0, second: 0)
#let to-x(date) = (date - reference-time).seconds()
#let make-label(date) = rotate(-90deg, reflow: true, date.display())


#lq.diagram(
  title: [Time-Series Data],
  xlabel: [Date],
  ylabel: [Value],
  xaxis: (
    ticks: dates.map(to-x).zip(dates.map(make-label)),
    subticks: none
  ),
  lq.plot(
    dates.map(to-x), values, 
    mark: "o", 
    label: [Series A]
  ),
)

A built-in datetime tick formatter is actually on the roadmap. This could make it easier in the future. However, if you need precise control of the datetimes to be displayed, the manual solution proposed above will still be the best.

2 Likes