I’m trying to define a function that returns a showybox for which the width is either a user-given width or when not specified, the width of the body or 95% of the width of the parent item, whatever is smaller.
This is my attempt
#let defbox(self: none, title: none, width: none, body) = context {
  layout(size => [
    #let w = 0.0
    #if width == none { w = calc.min(size.width,measure(body).width) } else { w = width }
    #showybox(
      width: w,
      title-style: (
        boxed-style: (
          anchor: (x: left, y: horizon),
        ),
        weight: "bold",
      ),
      title: title,
      body + [#w] + [ #size.width] + [ #measure(body).width],
    )
  ]
)
}
As you can see, I added some “debugging” to the body because I have some issues.
What I observe is that
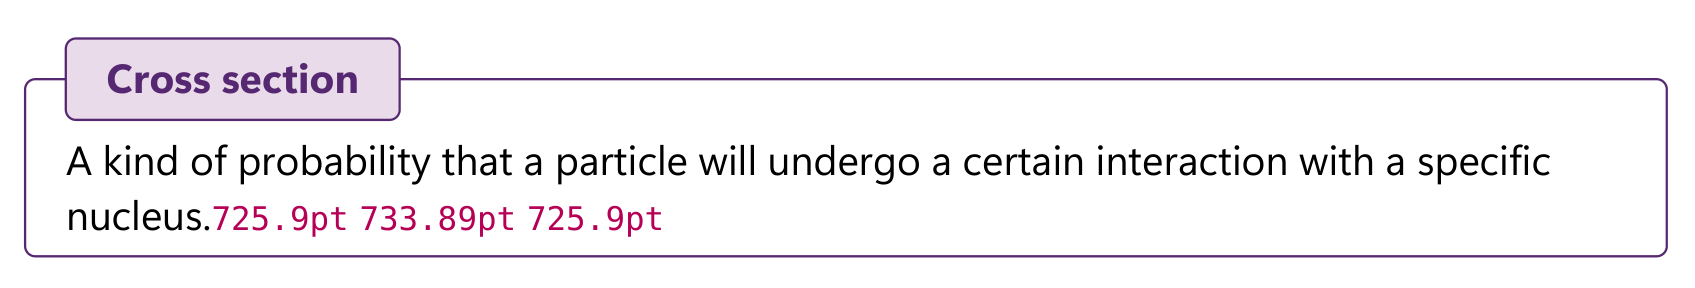
- If the body width is larger than the page width, it’s ok.
#defbox(
  title: "Cross section",
  "A kind of probability that a particle will undergo a certain interaction with a specific nucleus.",
)
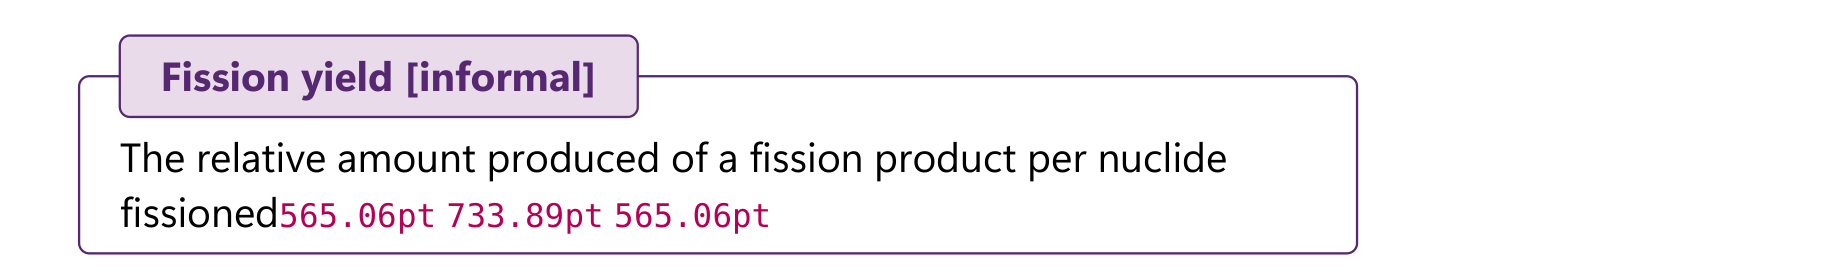
2. If the body width is smaller than the page width, it seems to cut off the body even more but I don’t understand on what the cut off is based. Example below: plenty of white space left
#defbox(
  title: [Fission yield [informal]],
  [The relative amount produced of a fission product per nuclide fissioned],
)
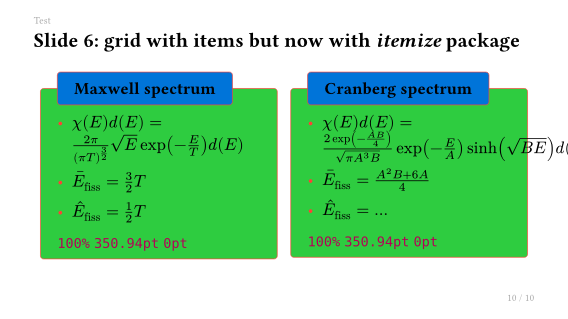
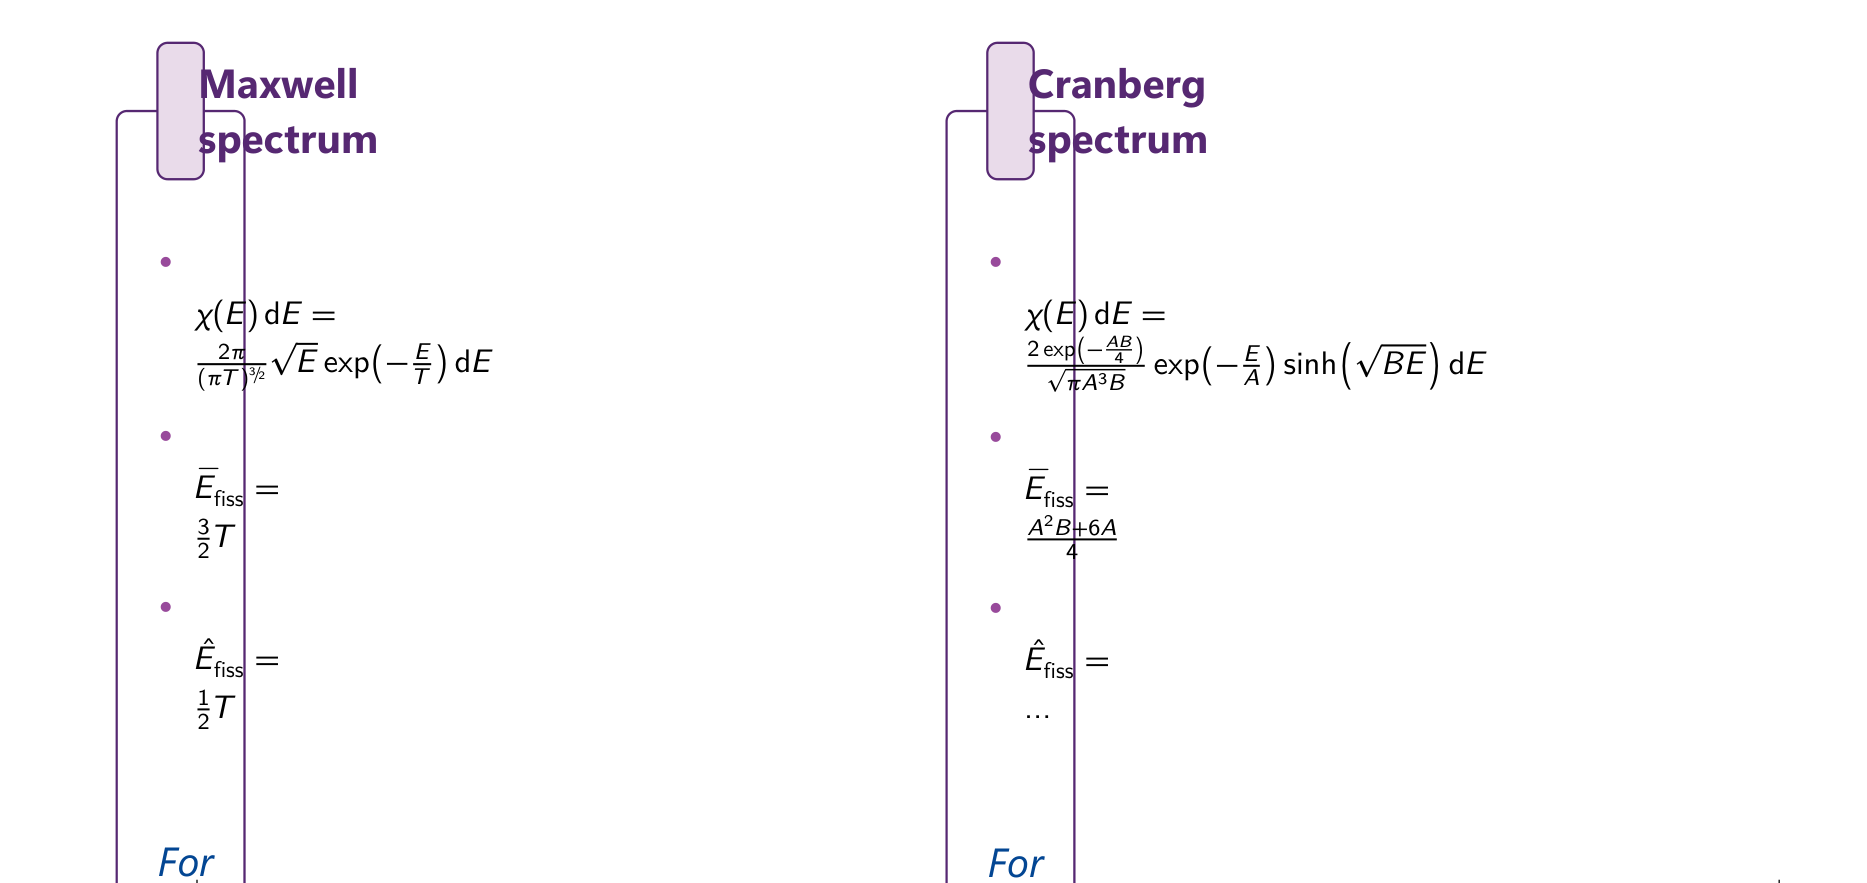
3. If I have math and itemized lists, it completely miscalculates the body width.
#{
  show math.equation: set text(size: 0.8em)

  grid(
    columns: (1fr, 1fr),
    inset: (x: 10pt),
    defbox(title: "Maxwell spectrum", [
      #v(1em)
      - $χ(E) dd(E) = (2π)/(π T)^(#sfrac(3, 2)) sqrt(E) exp(-E/T)dd(E)$
      - $dash(E)_text("fiss") = 3/2 T$
      - $hat(E)_text("fiss") = 1/2 T$

      #v(2em)

      _For #ce("^235U")_
      - $T = #qty("1.33", "mega electronvolt")$
      - $dash(E)_text("fiss") ≈ #qty("2", "mega electronvolt"), hat(E)_text("fiss") ≈ #qty("0.67", "mega electronvolt")$
    ]),
    defbox(title: "Cranberg spectrum", [
      #v(1em)
      - $χ(E) dd(E) = (2 exp(- (A B)/4)) / sqrt(π A^3 B) exp(- E/A) sinh(sqrt(B E)) dd(E)$
      - $dash(E)_text("fiss") = (A^2 B +6A)/4$
      - $hat(E)_text("fiss") = …$

      #v(2em)

      _For #ce("^235U")_
      - $A = #num("0.965")$, $B = #qty("2.29", "per mega electronvolt")$
      - $dash(E)_text("fiss") ≈ #qty("1.98", "mega electronvolt"), hat(E)_text("fiss") ≈ #qty("0.72", "mega electronvolt")$
    ]),
  )
}
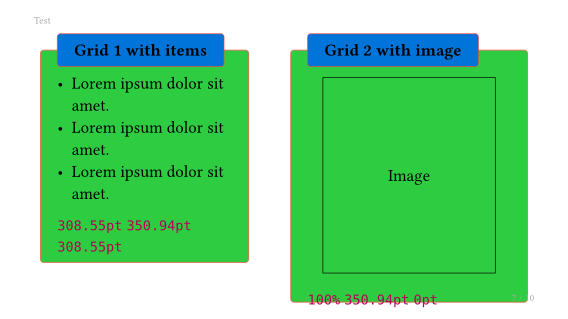
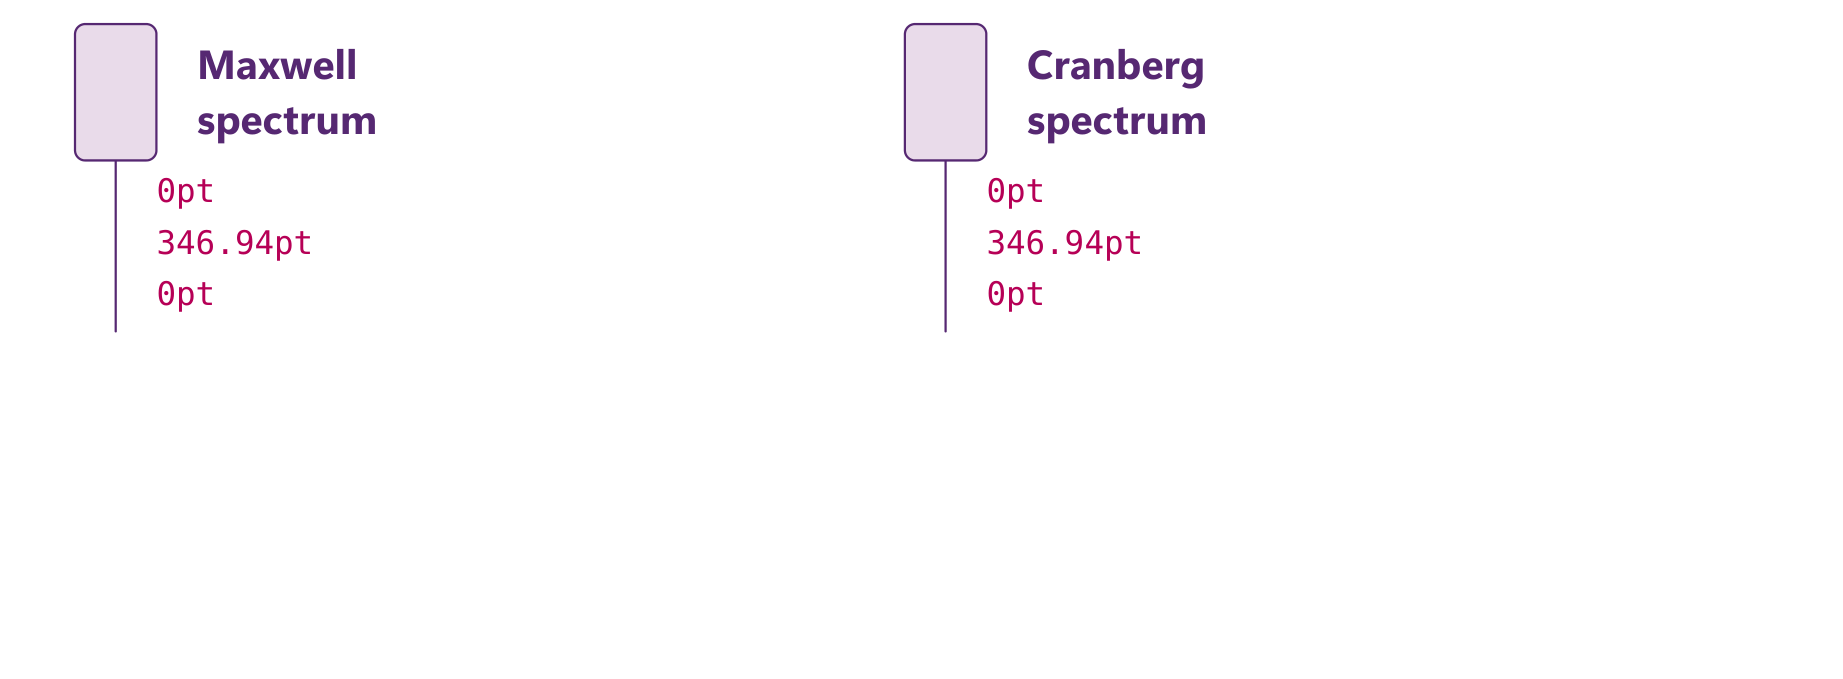
4. Having images gives widths of zero…
#grid(
  columns: (1fr, 1fr),
  inset: (x: 10pt),
  defbox(title: "Maxwell spectrum", align(horizon + center)[
    #image("/plots/PromptChiMaxwell.svg", fit: "contain", width: 95%)
  ]),
  defbox(title: "Cranberg spectrum", align(horizon + center)[
    #image("/plots/PromptChiCranberg.svg", fit: "contain", width: 95%)
  ]),
)
So what I’m doing wrong here? What am I missing?