I have created a cetz chart (in fact, using the fletcher package for convenience) and have saved it in a seperate .typ file. This is what the file assets/chart1.typ contains:
#import "@preview/fletcher:0.5.7" as fletcher: diagram, node, edge, shapes
#diagram(
  // ... nodes & edges go here
)
In my main document, I place the chart like this:
#figure(
  include "assets/chart1.typ",
  caption: [Figure caption here.]
) <fig:chart1>
I would like to have a handy option for setting the desired chart’s width, e.g., 90% of the document width, as I would do with images placed in a figure. I tried this but it has no effect:
#figure(
  block(include "assets/chart1.typ", width: 90%),
  caption: [Figure caption here.]
) <fig:chart1>
I’ve found this suggestion but don’t understand how to implement it in my case.
Do you just want to scale the entire diagram (including the line widths etc…) or do you want to change the cell-size of the fletcher diagram to get the correct width of the diagram while conserving all other sizes?
The easiest and most straightforward way to scale is to use scale with reflow: true, since it’s not yet on by default.
#import "@preview/fletcher:0.5.7": diagram, edge, node
#set scale(reflow: true)

#let diagram1 = diagram({
  node((0, 0))[$A$]
  edge("->")
  node((1, 0))[$B$]
})

#figure(scale(100%, diagram1), caption: [Figure caption here.])
But if you insist on a specific width…
#import "@preview/fletcher:0.5.7": diagram, edge, node
#let scale-to-width(width, body) = layout(page-size => {
let size = measure(body, ..page-size)
let target-width = if type(width) == ratio {
page-size.width * width
} else if type(width) == relative {
page-size.width * width.ratio + width.length
} else {
width
}
let multiplier = target-width.to-absolute() / size.width
scale(reflow: true, multiplier * 100%, body)
})
#let diagram1 = diagram({
node((0, 0))[$A$]
edge("->")
node((1, 0))[$B$]
})
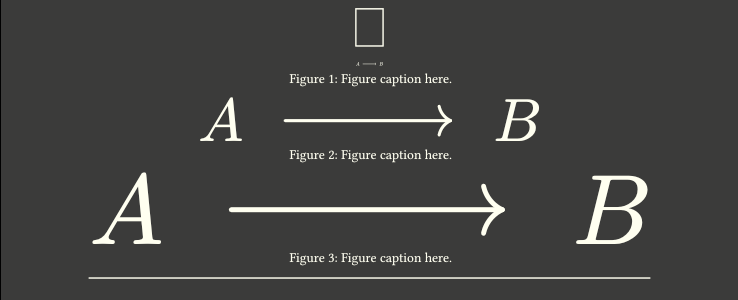
#align(center, rect(width: 2em, stroke: 1pt))
#figure(scale-to-width(2em, diagram1), caption: [Figure caption here.])
#figure(scale-to-width(50% + 50pt, diagram1), caption: [Figure caption here.])
#figure(scale-to-width(100%, diagram1), caption: [Figure caption here.])
#line(length: 100%)
P.S. Thankfully, figure does not create a new container, or probably just not a rigid/fixed container, so we can still fetch the page’s size from the inside.
3 Likes