Hi everyone,
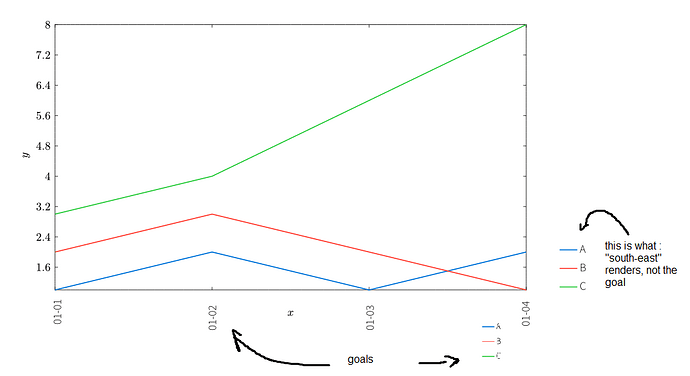
I would like to ask you how to rotate labels on an axis, and make the legend smaller and control its position:
My working example:
#import "@preview/cetz:0.3.2": canvas, draw
#import "@preview/cetz-plot:0.1.1": plot

#let (names, ..data) = csv.decode(```
Date,A,B,C
2023-01-01,1,2,3
2023-01-02,2,3,4
2023-01-03,1,2,6
2023-01-04,2,1,8
```.text)

// Hack: use TOML parser to parse date strings
#let dates = data.map(x => toml.decode("date = " + x.first()).date)

// Each x value is the number of days since the first row date
#let xs = dates.map(x => (x - dates.first()).days())

// Make an array of (x, y) coordinates for the given column index
#let series(j) = range(data.len()).map(i => (dates.at(i), float(data.at(i).at(j))))

#canvas({
  import draw: *

  // Set-up a thin axis style
  set-style(
    axes: (stroke:  (thickness: .5pt, dash: none, paint: auto),
              tick: (stroke: .5pt)),
    label:(angle:90), //this did not work!
    legend: (stroke: none, orientation:ttb, item: (spacing: .3), scale: 80%),
  )

  plot.plot(size: (16, 9), x-tick-step: none, x-ticks: series(1).map(x => (x.at(0).day(), [#x.at(0).display("[month]-[day]")])),
  legend: "south",{
    for j in range(1, names.len()) {
      plot.add(series(j).map(x => {(x.at(0).day(), x.at(1))}), label: names.at(j))
    }
  })
})
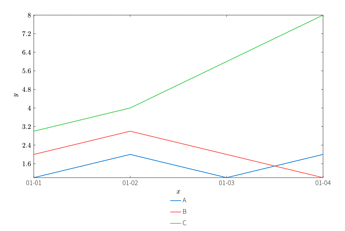
Results:
desired results:


