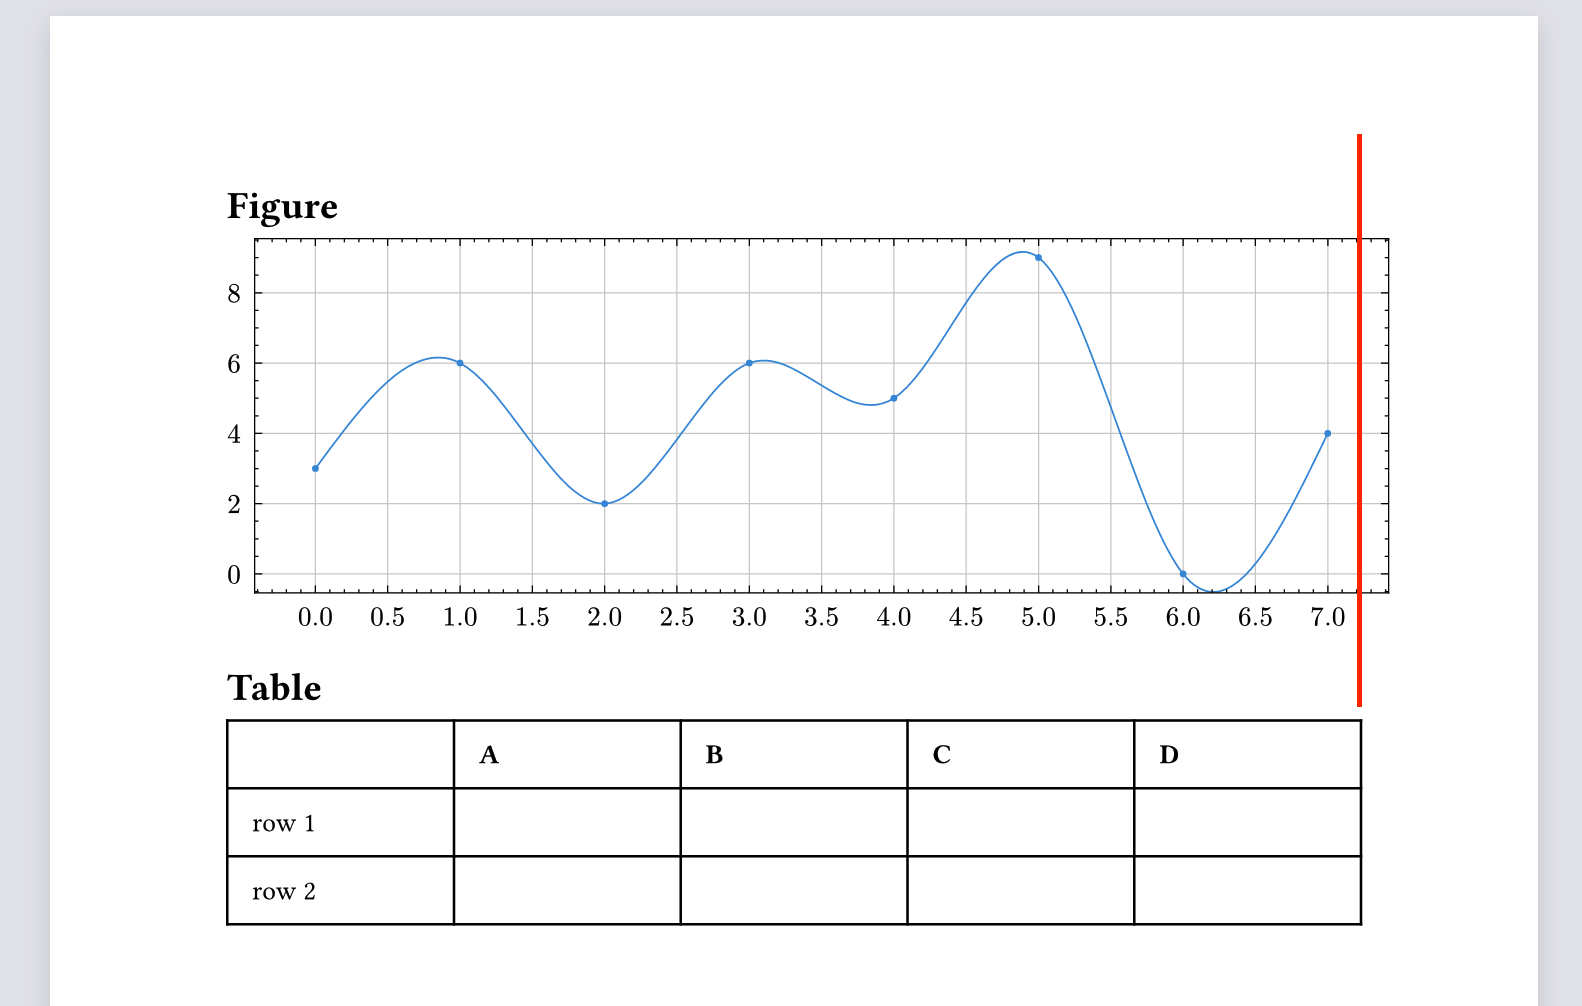
I’m trying to figure out how to set the width of a graph to 100% when using lilaq to draw it. I’ve attempted to do this using the layout keyword, as shown in the example code below, but the graph is overflowing to the right, beyond the available width.
Is there a good way to set the width of lq.diagram to 100%?
#import "@preview/lilaq:0.4.0" as lq
#set page(paper: "a4")

= Figure
#block(
  width: 100%,
  layout(size => {
    lq.diagram(
      width: size.width,
      height: 5cm,
      lq.plot(range(8), (3, 6, 2, 6, 5, 9, 0, 4), smooth: true)
    )
  })
)

= Table
#table(
  columns: (1fr, 1fr, 1fr, 1fr, 1fr),
  inset: 10pt,
  align: horizon,
  table.header(
    [], [*A*], [*B*], [*C*], [*D*]
  ),
  [row 1],
  [],[],[],[],
  [row 2],
  [],[],[],[],
)