Your code is incomplete and doesn’t compile, so I have done some guesswork in this code.
#import "@preview/lilaq:0.5.0" as lq
#let unit(x) = x // FIXME:
#let linear-regression(xs, ys) = {
let len = xs.len()
let x_mean = xs.sum() / len
let y_mean = ys.sum() / len
let sum_dx2 = xs.map(x => calc.pow(x - x_mean, 2)).sum()
let sum_dxdy = xs.zip(ys).map(((x, y)) => (y - y_mean) * (x - x_mean)).sum()
let a = sum_dxdy / sum_dx2
let b = y_mean - a * x_mean
(a, b)
}
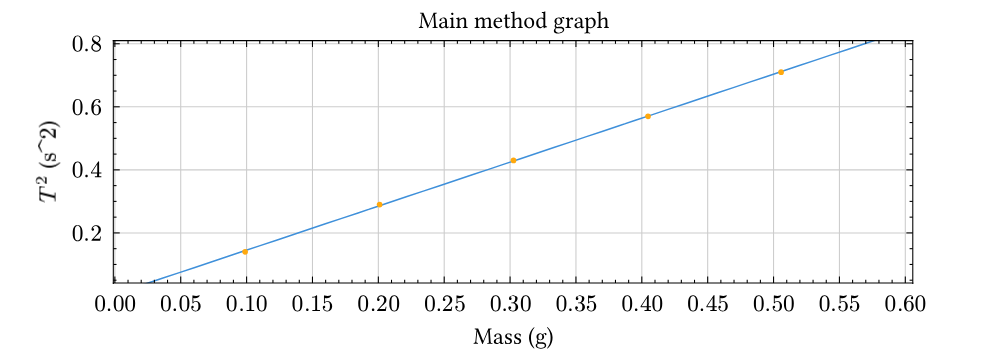
#let xs = (0.09883, 0.20096, 0.30255, 0.40468, 0.50568)
#let ys = (0.14, 0.29, 0.43, 0.57, 0.71)
#let (a, b) = linear-regression(xs, ys)
#let best-fit-line = x => a * x + b
#let margin = 0.1
#align(center)[
#lq.diagram(
title: [Main method graph],
xlabel: [Mass ($#unit[g]$)],
ylabel: [$T^2$ ($#unit[s^2]$)],
margin: 0%,
width: 90%,
lq.plot(
mark: none,
lq.linspace(
calc.min(..xs) - margin,
calc.max(..xs) + margin,
),
best-fit-line,
),
lq.scatter(xs, ys),
)
]
My solution is based off How do you draw a trend line in typst? and consequently Linear regression · lilaq-project · Discussion #113 · GitHub
One problem with this code is, it doesn’t give y=1.41119x, but roughly y=1.39 + 0.005, so did you want a line with b=0? Then the linear-regression function needs to change.
Another problem is that I have to hardcode a margin value and use that when computing the linspace for the lq.plot, not really ideal if the data points can vary in orders of magnitude…