Hi @robbo911 and welcome to Typst and Lilaq!
In Typst, it is quite easy to do some scripting. For example, you can write a function for normalizing your data
#let normalize(values) = {
  let max = calc.max(..values)
  values.map(value => value / max)
}
so you can reuse this function for both your y and r arrays. Do you want to also rescale the bottom of your data, I mean bring the minimum down to 0? In this case, you’ll want this as your normalization function:
#let normalize(values) = {
  let min = calc.min(..values)
  let range = calc.max(..values) - min
  values.map(value => (value - min) / range)
}
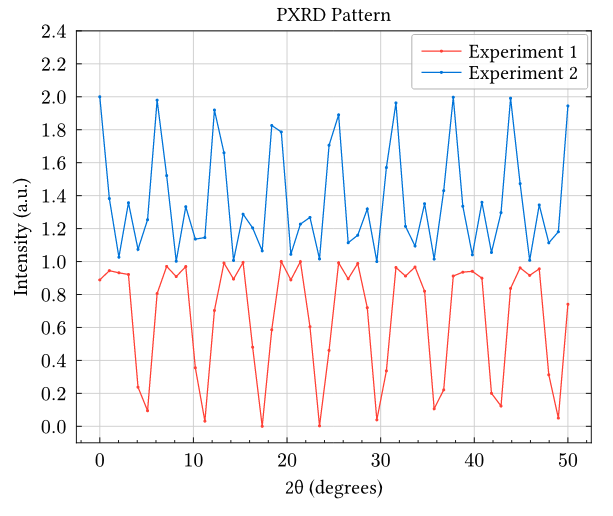
After normalization, all that remains is to add 1 to the second array because now you know that both arrays will cover the range [0, 1].
Two tips for your diagram:
smooth: falseis already the default, so you can omit it. Smoothing will usually only be useful very few scenarios.- If you have more than one plot like this, you can define a color cycle with one line of code instead of defining the colors within
lq.plot:#show: lq.set-diagram(cycle: (red, blue)), see Using style cycles − Lilaq.
#let normalize(values) = {
  let min = calc.min(..values)
  let range = calc.max(..values) - min
  values.map(value => (value - min) / range)
}

#show: lq.set-diagram(cycle: (red, blue))

#lq.diagram(
  width: 10cm, height: 8cm,
  xlim: (3, 30),
  ylim: (0, 9000),
  legend: (position: top + right),
  margin: (top: 20%),
  xaxis: (subticks: 4, mirror: (ticks:false)),
  yaxis: (subticks: none),
  title: [PXRD Pattern],
  xlabel: [2θ (degrees)],
  ylabel: [Intensity (a.u.)],
  lq.plot(
    x,
    normalize(y),
    label: [Experiment 1],
    mark-size: 2pt,
  ),
  lq.plot(
    q,
    normalize(r).map(v => v + 1),
    label: [Experiment 2],
    mark-size: 2pt,
  )
)