First things first, see the package repository here GitHub - janekfleper/mpl2typ: Structured export of Matplotlib figures to Typst · GitHub. There is no documentation yet, just a lot of examples. Please refer to the notebook examples/plot.ipynb to see which Matplotlib features are already implemented.
Introduction
If you look at the structure of Matplotlib figures, you will find that all the required drawing primitives are built into Typst. A fancy gridspec layout can be implemented using a grid(), the linestyles in Matplotlib can be replicated using the stroke() function, and we can use curves to draw arbitrary markers and meshes. These are only a few examples where Typst can be used to render Matplotlib figures. However, generating a “useful” Typst file from a Matplotlib figure is not easy since the structure is completely discarded when saving the figure using a custom backend (see the package mpl-typst). The resulting file is just a collection of texts, paths, meshes etc. If you just want to change the color, shape, or size of your markers, this requires significant effort.
With mpl2typ, the Matplotlib figure is parsed by digging into the grids, axes, lines, collections etc. While this is significantly more complicated than the export using the custom backend, the reward is a readable Typst file that you can easily edit if you want to modify anything about your figure. This is exactly the workflow I wanted for the figures in my thesis, which was my motivation to develop this package.
You can find detailed comments about the package (and the through process behind it) in the README of the repository .
Example
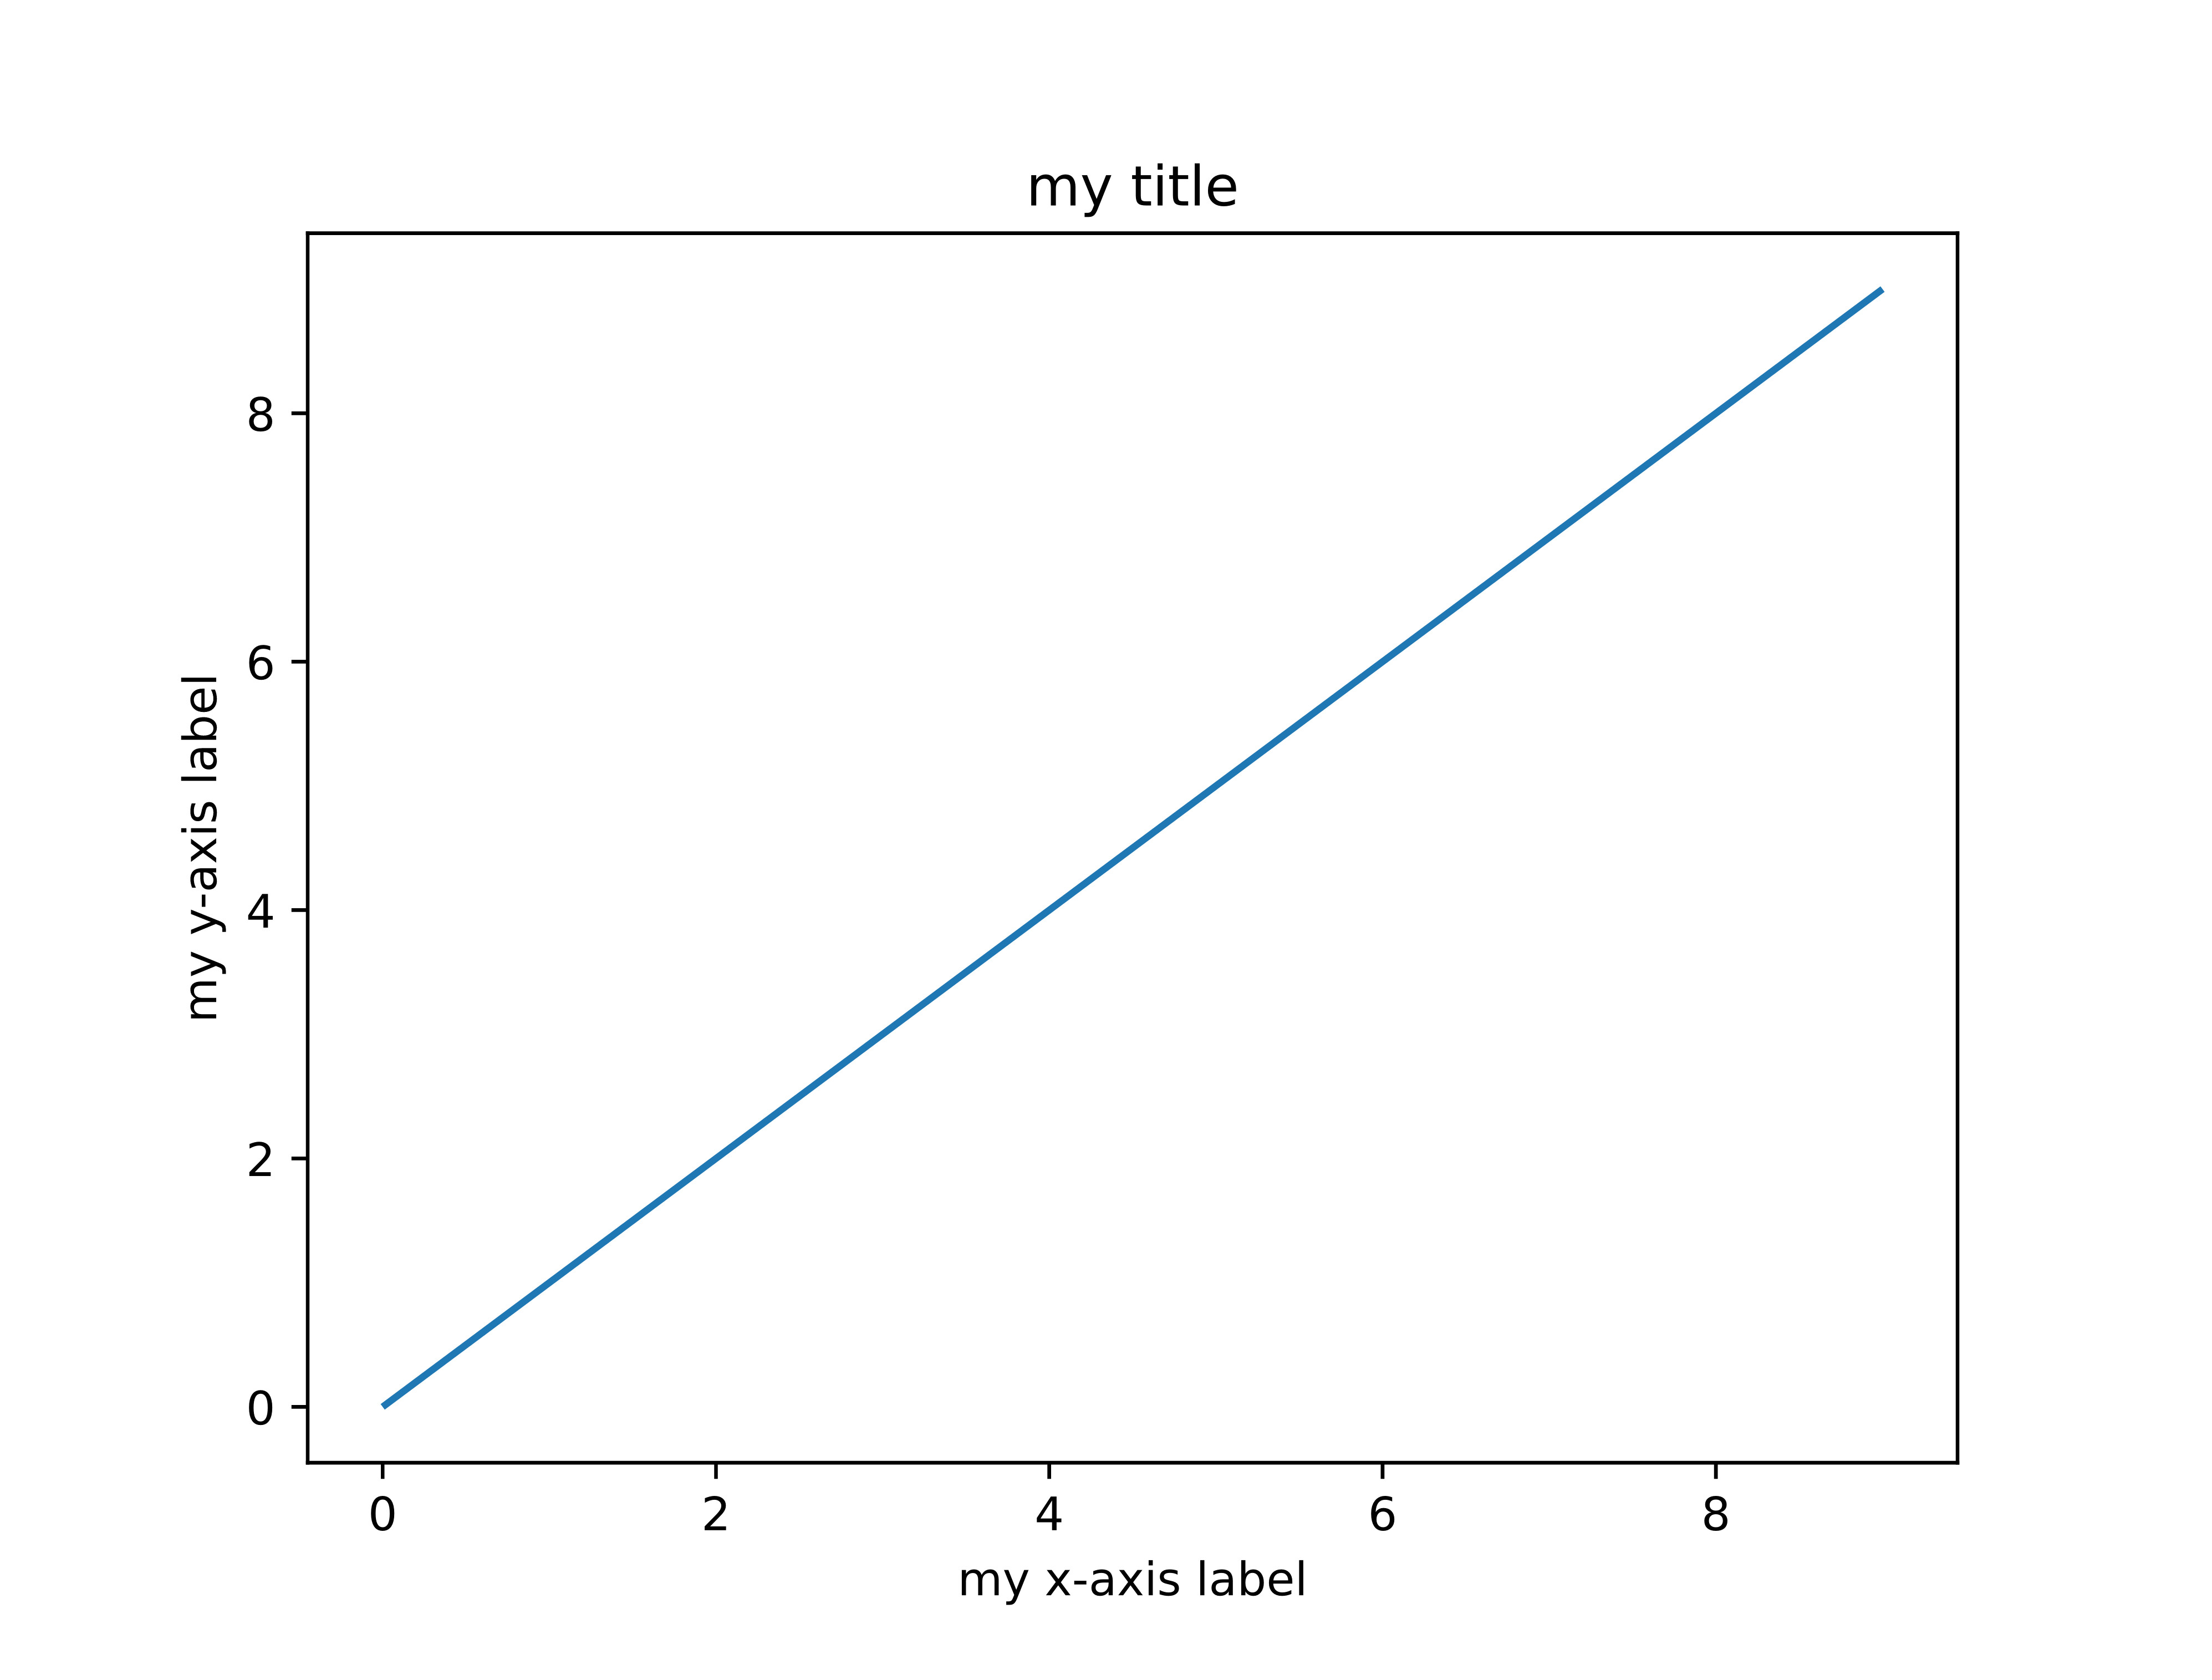
As the simplest example we can use a single axes with a title, axis labels and a simple line. You can find this specific example in examples/plot-simple/. As an example to modify the figure, set the variable marker-line-0 to
let marker-line-0 = markers.diamond(4pt, fill: purple, stroke: black)
and see for yourself how easy it is to style your figures in real time thanks to the fast Typst compilation.
This is the exported code to render this figure in Typst
// This file is automatically generated by some development version of mpl2typ
#import "/mpl2typ/lib.typ": *
#import "/style.typ": *

#set page(width: auto, height: auto, margin: 0.9em)

#let axes-0(xlim: (-0.45, 9.45), ylim: (-0.45, 9.45), dpi: 100.0) = {
  let xscale = 1 / (xlim.at(1) - xlim.at(0)) * 100%
  let yscale = 1 / (ylim.at(1) - ylim.at(0)) * 100%
  let xshift = 50% - (xlim.at(0) + xlim.at(1)) / 2 * xscale
  let yshift = 50% - (ylim.at(0) + ylim.at(1)) / 2 * yscale

  let transform(point) = {
    let (x, y) = point
    return (x * xscale + xshift, 100% - (y * yscale + yshift))
  }

  let compute-scale(size) = calc.sqrt(size) * dpi / 72

  let data = json("data/axes-0.json")

  let title-center = (
    position: (50.0%, -2.255%),
    body: place(center + bottom, text(size: 1em + 2.0pt, fill: color.rgb("#000000"), [my title])),
  )


  let spines = (
    left: (bounds: (100.0%, 0.0%), stroke: (paint: color.luma(0.0%), thickness: 0.8pt, dash: "solid")),
    right: (bounds: (100.0%, 0.0%), stroke: (paint: color.luma(0.0%), thickness: 0.8pt, dash: "solid")),
    bottom: (bounds: (0.0%, 100.0%), stroke: (paint: color.luma(0.0%), thickness: 0.8pt, dash: "solid")),
    top: (bounds: (0.0%, 100.0%), stroke: (paint: color.luma(0.0%), thickness: 0.8pt, dash: "solid")),
  )

  let label-xaxis = (
    position: (50.0%, 107.921%),
    body: place(center + top, text(size: 1em, fill: color.rgb("#000000"), [my x-axis label])),
  )

  let label-yaxis = (
    position: (-4.87%, 50.0%),
    body: rotate(-90.0deg, place(center + bottom, text(
      size: 1em,
      fill: color.rgb("#000000"),
      bottom-edge: "descender",
      [my y-axis label],
    ))),
  )

  let xaxis-major-ticks = (
    locs: (-2.0, 0.0, 2.0, 4.0, 6.0, 8.0, 10.0),
    labels: ($−2$, $0$, $2$, $4$, $6$, $8$, $10$),
    tick-style: (direction: "out", line: (length: 3.5pt, angle: 90deg, stroke: color.rgb("#000000") + 0.8pt)),
    label-style: (pad: 3.5pt, rotation: -0.0deg, text: (size: 1em, fill: color.rgb("#000000"))),
  )

  let yaxis-major-ticks = (
    locs: (-2.0, 0.0, 2.0, 4.0, 6.0, 8.0, 10.0),
    labels: ($−2$, $0$, $2$, $4$, $6$, $8$, $10$),
    tick-style: (direction: "out", line: (length: 3.5pt, angle: 0deg, stroke: color.rgb("#000000") + 0.8pt)),
    label-style: (pad: 3.5pt, rotation: -0.0deg, text: (size: 1em, fill: color.rgb("#000000"))),
  )

  let stroke-line-0 = (paint: color.rgb("#1f77b4"), thickness: 1.5pt, cap: "butt", join: "round", dash: "solid")
  let marker-line-0 = none
  let line-0 = (data: data.at("line-0"), stroke: stroke-line-0, marker: marker-line-0, transform: transform)

  std.place(rect(width: 100%, height: 100%, fill: color.luma(100.0%)))
  draw.line(..line-0)
  axes.xaxis-ticks(show-ticks: (bottom,), show-labels: (bottom,), ..xaxis-major-ticks, transform)
  axes.yaxis-ticks(show-ticks: (left,), show-labels: (left,), ..yaxis-major-ticks, transform)
  axes.spines(spines)
  draw.text(..title-center)
  draw.text(..label-xaxis)
  draw.text(..label-yaxis)
}


#let grid-0() = {
  let padding = (left: 12.5%, right: 10.0%, top: 12.0%, bottom: 11.0%)
  place(top + left, dx: padding.left, dy: padding.top, block(
    width: 100% - padding.right - padding.left,
    height: 100% - padding.top - padding.bottom,
    fill: none,
    stroke: none,
    grid(
      columns: (1fr,),
      rows: (1fr,),
      column-gutter: (),
      row-gutter: (),
      axes.cell(position: (0, 0), shape: (1, 1), axes-0()),
    ),
  ))
}
#let figure(width: 16.256cm, height: 12.192cm) = {
  show: figure-style
  block(
    width: width,
    height: height,
    fill: color.luma(100.0%),
    stroke: (paint: color.luma(100.0%), thickness: 0.0pt, dash: "solid"),
    { grid-0() },
  )
}

#figure()
Contributions
If you are an experienced Matplotlib and Typst user and you are interested in collaborating, feel free to reach out.